
Graphing automated support and resistance levels for currency forex markets.
I created a indicator using the MQL5 language to generate support and resistance levels on a normal bar / tick chart. This works on any timeframe and on any amount of bars. Although it’s noted that a longer timeframe, and thus bars would be more beneficial when using it for life trading. Where traditional drawing of support and resistance levels often use the most outer edges of an group of bars, this indicator looks at the over all placement of the bars. Including both the open, close, high and low levels of each bar in the series.
The basic concept is as follows:
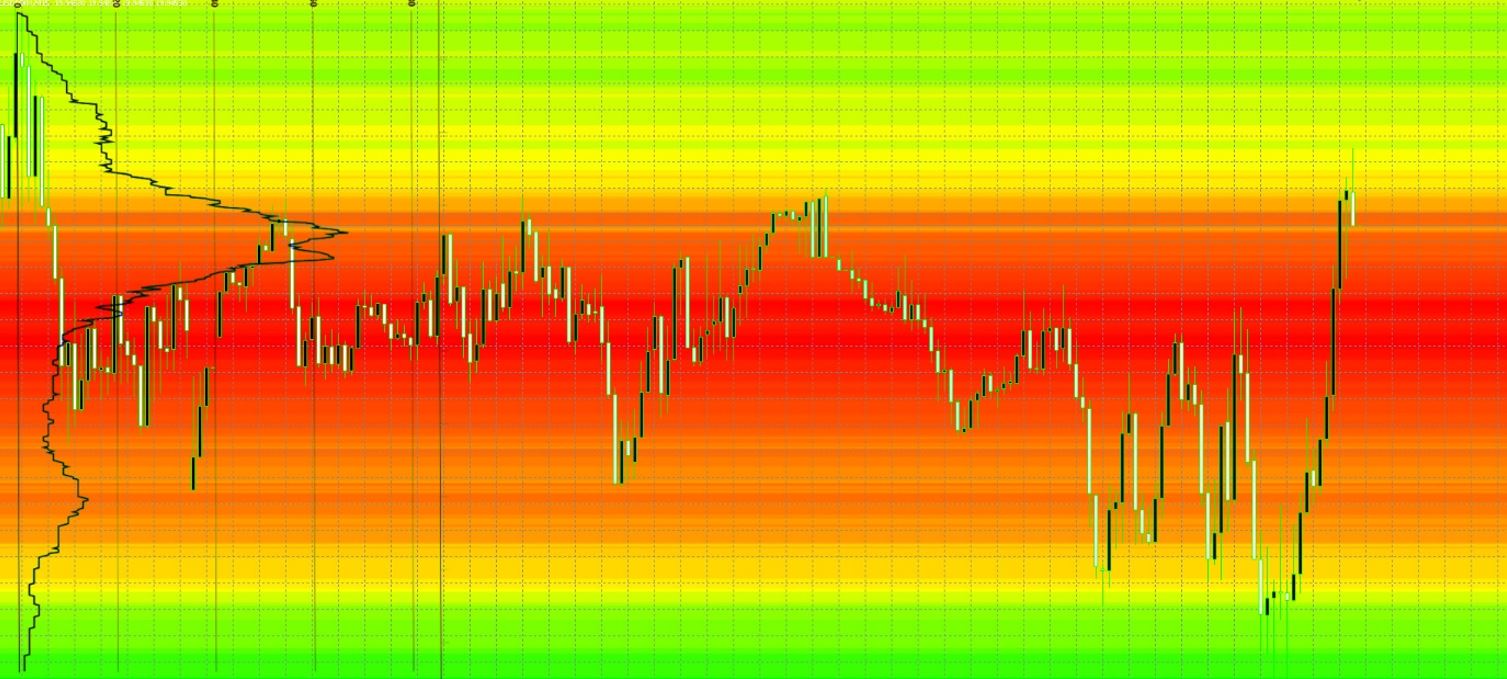
The currant graph is split into a grid. Each time a bar is found inside the grid it’s marked in the corresponding array representing the grid.
Once done, from left to right all instances of active grids is added up, then repeated down the grid until you find the number of active grid points on the Y axes. After this an color heat map is applied to the corresponding Y entries of the grid with an higher number being assigned to red and the lower numbers green. There is some additional calculation involved to spread the head map evenly across the grid however for simplicity sake we will just leave it as is.
Full code and code snippet below:
https://github.com/JacoMoolman/MT5files/blob/master/JMTIV2.mq5

Demonstration:
Please note since the making of the video below some improvements to the memory usage and speed of the indicator has been made.
Should you wish to buy this indicator you can purchase or download a demo here: