
Using Genetic Algorithms to find winning lotto numbers
By Jaco Moolman
Please note or pre notice: Although the lotto numbers were used as a basis any output from this study should not be considered to increase one’s chances of winning any large amount in the lotto. As the outcome of any lotto draw are not dependent on previous draws. Trying to predict future numbers based on past results is an exercise in futility.
The only possible way the output of this algorithm would be beneficial is if you were able to travel back in time and played every lotto using the final result of the algorithm. And even then, you would most likely only break even at best. Because of this I opted not to determine how much every individual ticket might have won. Rather using the total numbers winning per member as the determining factor.
The aim is to find a set of lotto numbers that will win the greatest number of times during a single draw using the last 7 years of lotto results. This final set of number would then have the best chance of winning the greatest number of times if played over the entire data set.
To accomplish this, I opted to use an older but still relevant approach by means of a genetic algorithm instead of a more modern AI algorithm.
A generic algorithm is based on biological entities with DNA that then in turn gets mixed during reproduction to then form the next generation.
Two main factors come to play:
- The first being the preverbal “survival of the fittest”, where external influences like predators, climate etc come into play.
- The second being random mutation. This one might argue being the more important of the two factors. As without random mutation a species might only adapt for survival opposed to overcoming and thriving as a species.
Thus, the concept of this genetic algorithm also follows a similar pattern, be it a much more simplistic one. A species with P number of members in the population is spawned. The initial population is created using a random set of numbers. Each member of the population contains T number of lotto tickets. And in this instance each ticket consists of 6 numbers. The combination of tickets and numbers forms each member’s “DNA”. Their strength is determined by how many winning tickets each member of the population has in its “DNA”. The strongest member of the population can then go on to spawn the next iteration. This process is then repeated until no further overall increase in the population’s strength is observed.
Crossbreeding in a genetic algorithm can be done a number of ways. Where the DNA of the two strongest members is mixed together to form a variety of new DNA sequences. In turn the method one can use to mix the DNA can also vary:
- Some include 50% split, where the first half of the “male” and the second half of the “female” DNA is combined.
- Taking every second DNA sequence from the “male” and “female” in an top down approach is also a way to combine the DNA and produce the next iteration.
- Another option would be to combine DNA in pure a random fashion.
- I opted for a more simplistic approach where only the very strongest member of the population may pass on its DNA in an asexual manner. Thus, the only determining factor in the population’s evolution would be the mutation value set beforehand.
The mutation value is set at a specific percentage value. This in turn will determine how likely it would be that one of the numbers of any of the members in the population will be replaced by a random number. With 0% being no chance and 100% resulting in a new random set every iteration. And intermediate step is also performed to make sure any new random number is not a duplicate of a number already existing in the specific ticket’s number set. This is as one can only choose one number once and thus not have duplicate numbers in the same ticket.
For all tests the number of tickets each member of the population has in its “DNA” has been kept constant with only the number of members in the population and the mutation value being altered for every run.
Arrays used for this algorithm:
- 2X 3 dimensional storing the Population ID number, number of rows of tickets and the actual numbers of each ticket.
- 1X 2 dimensional corresponding to the Population ID number and the number of winning tickets each member has for the specific iteration.
- 3X 1 dimensional storing various stats and corresponding data need to for the calculations.
The historical lotto numbers are read in from an external .CSV file while the output of the best set of numbers was output to and plain .TXT file should further analysis be needed.
A basic flow of the algorithm is as follows:
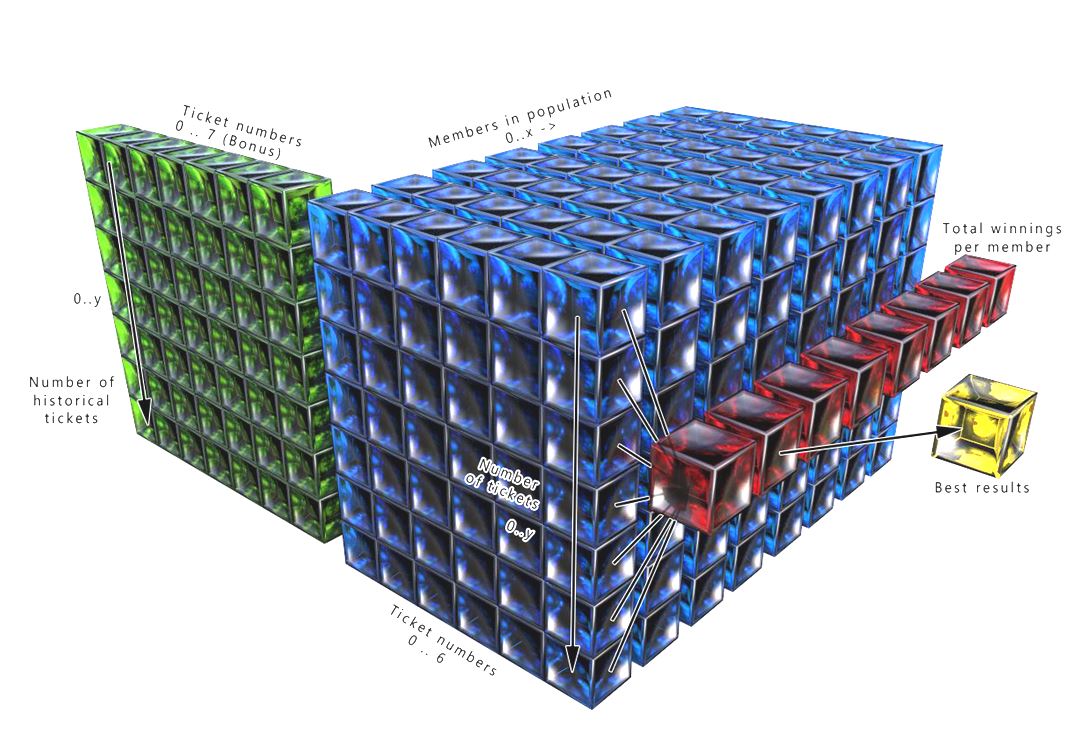
References for Fig.B and Fig.C
Green: Historical tickets
Blue: Population of members
Red: Total number of winning tickets per population member.
Yellow: Ticket with the highest number of winning tickets.
Each member in the population set of tickets is compared to the historical set of tickets. Any corresponding numbers for an individual set of numbers is calculated This is then added together obtain the total number of winning tickets per member in the population.
The member with the highest number of winning tickets is then used to repopulate the next generation’s tickets. Since the new population will then have the exact same set of numbers a final step is run. This step goes through all the numbers in the population and mutated depending on the mutation factor. Once the population has undergone the mutation process the next iteration can be run. This is then repeated until the desired outcome has been achieved or if no further growth is observed.
See Fig.A through Fig.C below.
Fig.A
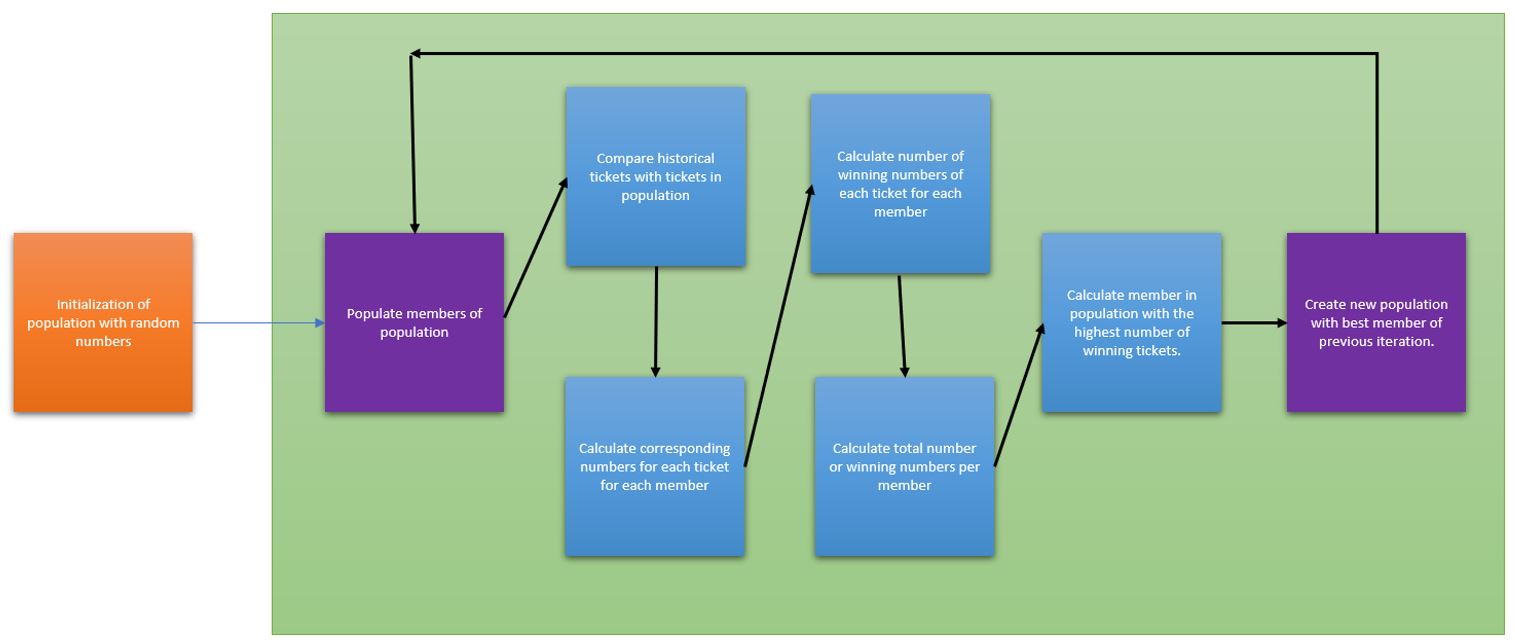
Fig.B
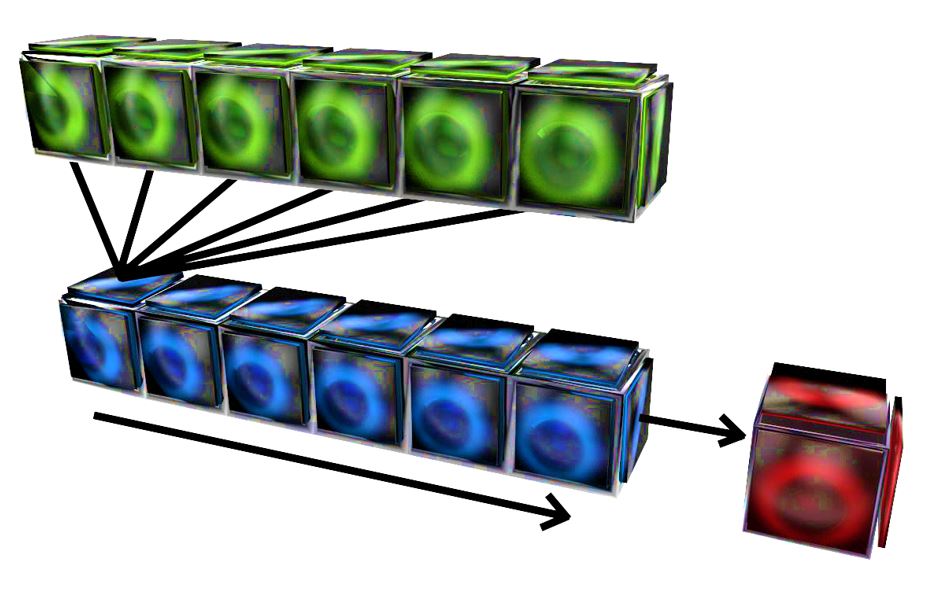
Each number of a set of tickets (blue) is compared to each number in a set of historical tickets (green). The number of corresponding numbers calculated and stored in a separate array. (red)
The highest winning number of tickets is stored in another array (yellow) along with the corresponding members’ ID or sequence in the associated array.
Fig.C
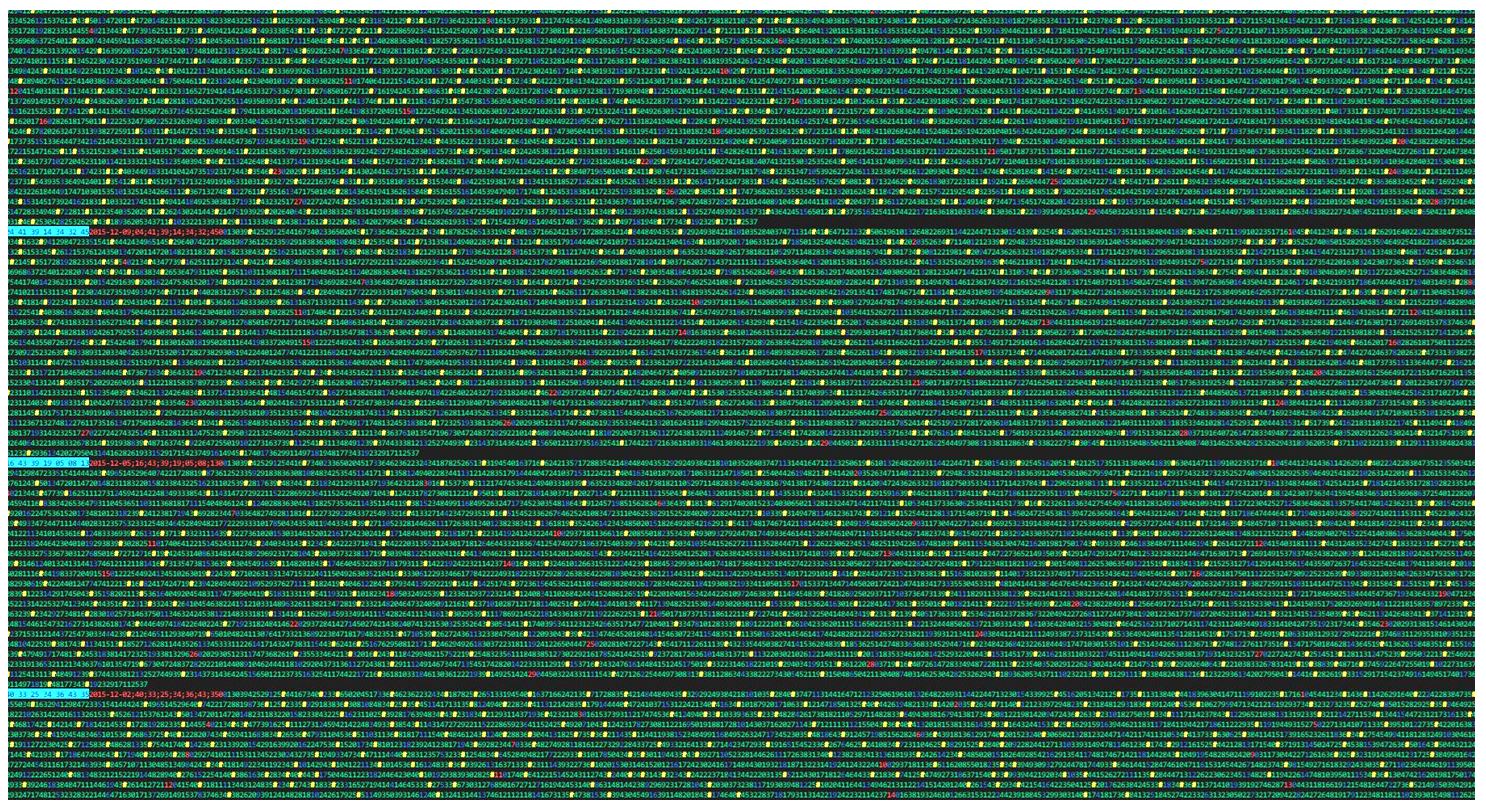
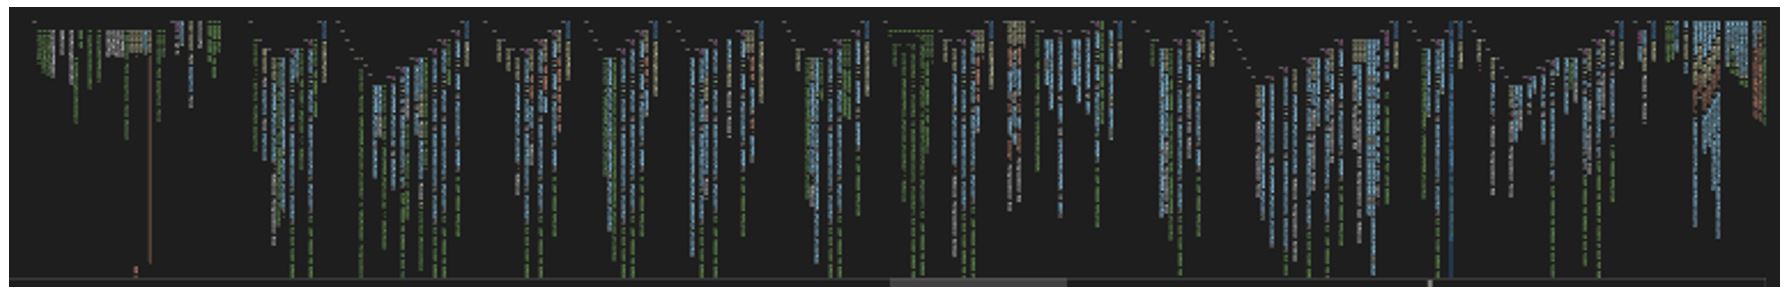
Below is a screenshot of the algorithm running. Below is a short indication of what every text colour represents.
- Yellow:
- Indicated a match has been found between the historical ticket and the ticket of the active member.
- Red:
- The population’s number and date & time of historical ticket
- Green:
- The numbers of the ticket.
- Blue:
- The numbers corresponding to the currant historical ticket.
- Cyan:
- The historical ticket’s numbers
Video of the algorithm running can be seen in the link here: https://youtu.be/vXchr6FxtR0
Below is a graphical representation of running the same genetic algorithm with varying inputs.
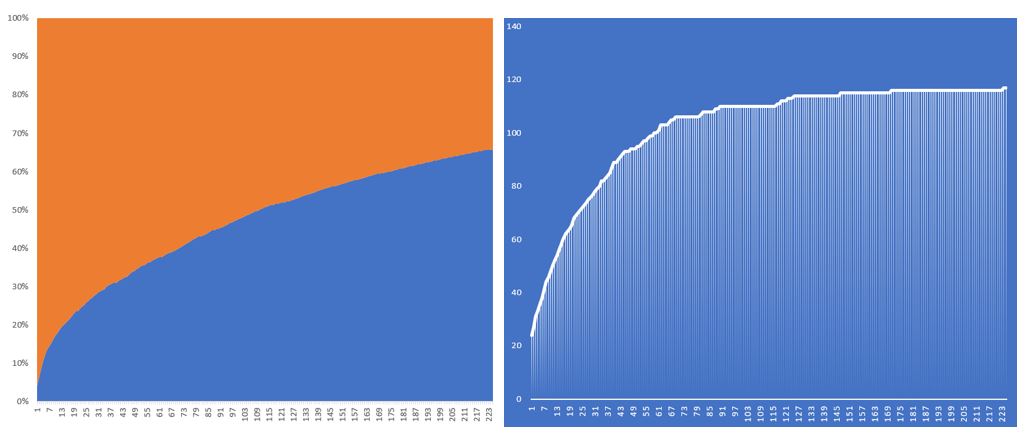
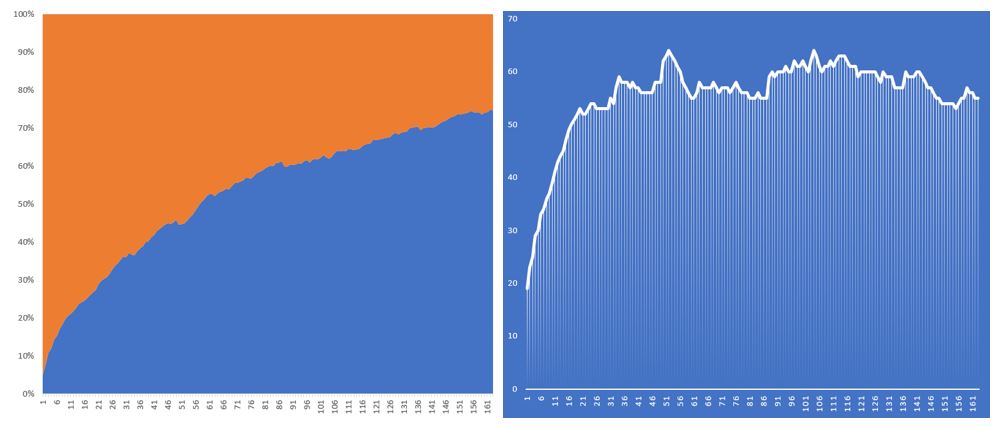
The graph on the left describes the growth rate or the rate that the population finds better combinations of numbers to increase their likelihood to have more correct numbers. With the X axis being represented by the number of iterations and the Y axis being the growth rate of the population.
The graph on the rights shows the number of winning numbers the best member of a population has. With the number of iterations shown on the X axis and the number or winnings the Y axis.
In Fig.1 a population of 30 and a very low mutation rate is applied. Initially the growth rate increases dramatically until 50% where the growth rate tapers off. With a low mutation rate multiple sequential iteration have the same number of winning tickets before a mutation occurs that once again increases the number of winning tickets.
This configuration has been run twice with similar results. Although the second run showed longer periods of null growth as the first.
Overall, between 400 and 420 iterations were run before growth slowed down enough for to warrant to the run to be halted.
It’s noted that with such a low mutation rate no negative growth where observed.
Fig.1 – P30 M1%: Runtime: 3.5 Hours
Run1:
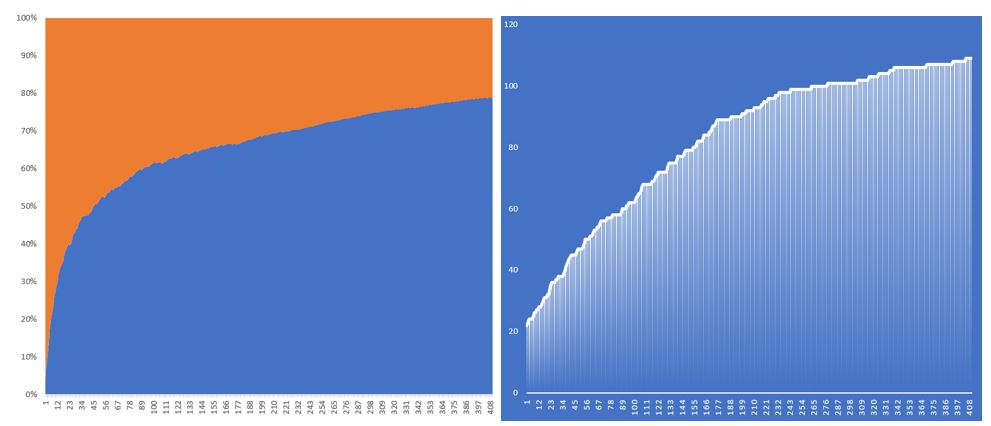
Run2:
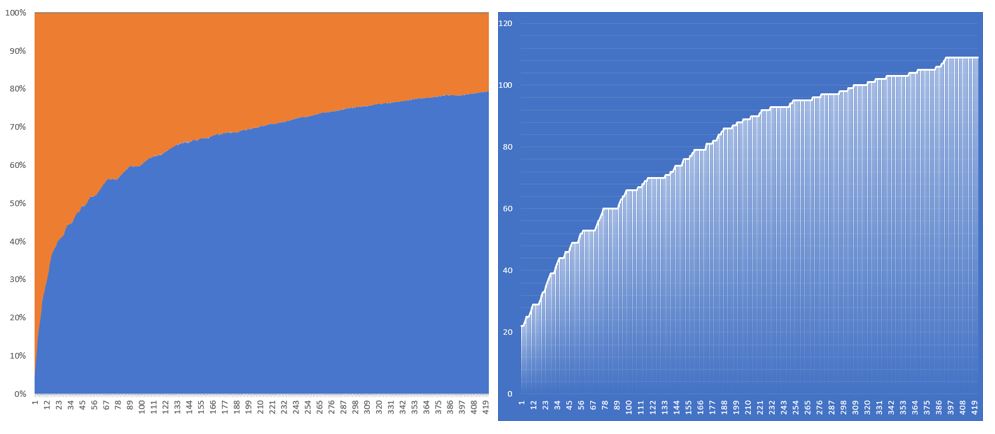
In Fig.2 only the number of members in the population where increased from 30 to 200. A noticeable slower growth rate is observed with tapering off between 20% and 30%. Despite the slower growth rate, the overall number of winning tickets increased more steadily with fewer gaps in-between growth periods. My conclusion is that a greater number in the population will result in an equal number of positive mutations.
It’s also noted that despite the slower, but more steady growth of the number of winning tickets the growth rate still tapered off and, in this case, stopped just after reaching 100 winning numbers.
Fig.2– P200 M1%: Runtime: 17 Hours
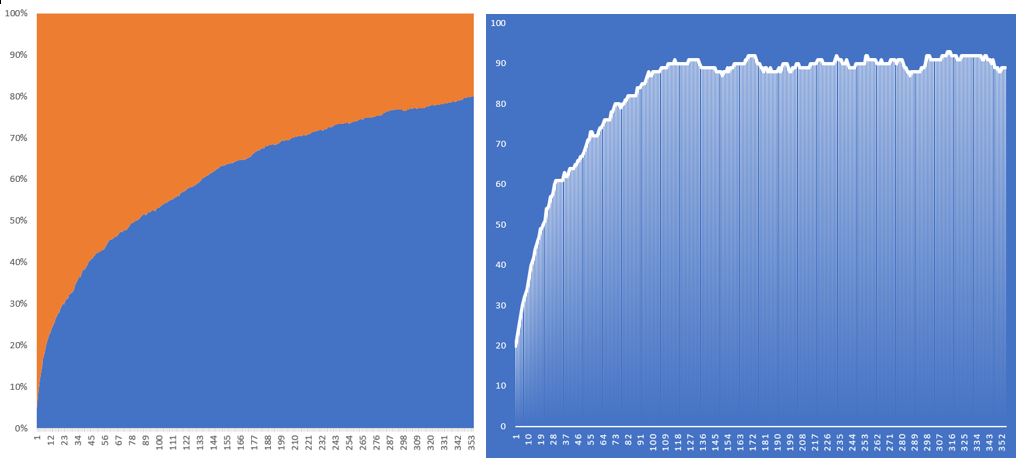
In Fig.3 below a mutation rate of 20% was set. Initially a strong rate of growth was seen, however after reaching about 80 winning lotto numbers it started to fluctuate at about 90 winning numbers. A decrease in winning numbers were also observed due to the moderately high mutation rate, however still kept stable.
Fig.3– P30 M20%: Runtime: 4 Hours
In Fig.4 below the mutation rate was kept that 20% however the number of members in the population was increased again to 200. This seemed to have decreased the negative growth in the number of winning tickets. However, it seems after very few iterations the growth rate almost flat lined with an equilibrium being reached between any member of the population achieving better or worse results.
Fig.4 -P200 M20% Runtime: 23 Hours
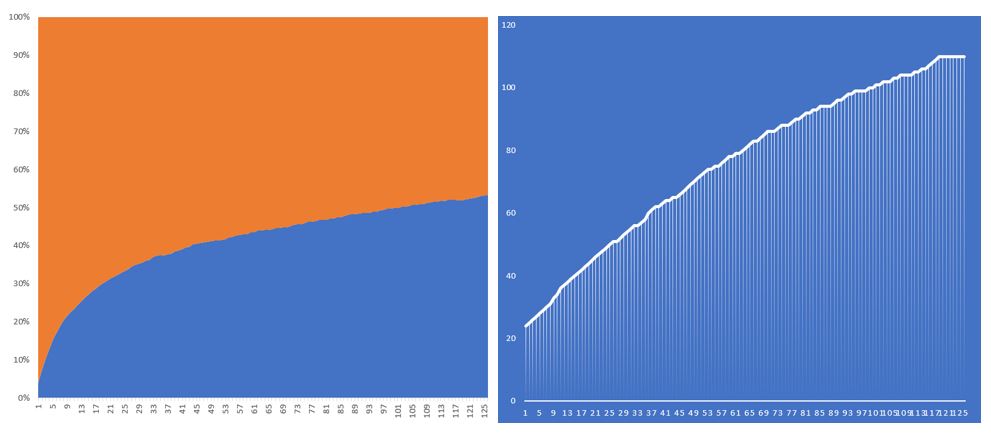
In Fig.5 below the mutation rate was set to 99%. It was surprising to find some initial growth in the number of winning tickets, however once reaching 50+ winning tickets the growth reverted to an almost random rate and might not be sustainable over the long term.
Fig.5 – P30 M99%: Runtime: 2.5 Hours
Code:
This algorithm was written in PowerShell V5.
The code for this genetic algorithm can be found on GitHub here:
https://github.com/JacoMoolman/GenLot/blob/master/GenLOT5.ps1
Conclusion:
Using the right tool for the job is essential. Writing all code from scratch instead of using already build libraries might be counter intuitive. However, one always learns something new when you do not follow the standard way of doing things.
As for the results of the algorithm, this just confirmed once again you can not use historical results to determine future results using a truly randomized model. And as the graphs above show even in optimal circumstances using any kind of model to predict the lotto will not result in any advantage above other people who just play the “quick pick” to choose their numbers for them.
I would conclude the project a success as I did not set out to find the “golden ticket”, but more sharpen my skills as a programmer and a hobbyist satiation. And in this I defiantly succeeded.