

I assume we all are familiar with the term down the rabbit hole. My rabbit was wanting to learn a couple more AWS servers I’ve not worked with yet or do not have enough experience in. I could do a course on each of the services and even get some shiny piece of paper I can add to my CV but where is the fun in that. I already know how to use services like AWS Lambda or EC2, however I’ve not played around with ones like AWS Batch and DynamoDB. So I decided I would build an app that uses these services and obviously through a bunch of AI in the mix while I’m at it.
The idea of my little app came around when I had a book I was interested in but did not have the an audio version of it. Sure I would just give it to any of the top text to speech models and say go, then I thought, if I had this issue I’m sure other would also. And what if someone wanted to listen to the same story but in another langue. Well that is how MicroTales was born. A platform where people can submit stories they wrote. Then not only have it converted into audio, but in multiple languages as well.
If you are in a hurry and want the TLDR here is the short version of how I built this application:
The Core App: A platform where users can submit original short stories. The system automatically summarizes, translates, and narrates these stories into 7 different languages, complete with voting, favorites, and user profiles.
AI & Machine Learning: AI does the heavy lifting. OpenAI (GPT-5-Nano & Moderation APIs) handles spam filtering, content moderation, language validation, summarization, and translation. Kokoro 82M (an open-source TTS model) runs locally to generate high-quality audio without expensive cloud TTS fees.
Compute & Infrastructure (EC2 & AWS Batch): The workload is split to optimize costs:
-
Always-On Web Server (t2.micro): Handles the Flask web app, routing, user sessions, and API requests via Nginx and Gunicorn.
-
On-Demand GPU Worker (g4dn.xlarge): Spun up dynamically via AWS Batch only when a new story needs processing. It uses its NVIDIA T4 GPU to generate the audio files, saves them to S3, and immediately shuts down to save money.
AWS Lambda Functions: Three lightweight Lambdas automate the backend:
-
Health Check: Pings the site hourly and auto-restarts the web EC2 instance if it crashes.
-
Batch Kick-Off: Monitors S3 for new story submissions and triggers the GPU audio processing job.
-
Daily Cost Reporter: Pulls AWS billing data and emails a daily breakdown of expenses.
Database (DynamoDB): Entirely serverless database management. Multiple tables handle user metadata, story votes, sequential atomic IDs, visitor analytics, server health metrics, and live application configs (meaning rate limits and moderation strictness can be changed without redeploying code).
-
Security: Built with a “fail-secure” philosophy. Zero hardcoded secrets (all API keys are AES-256-GCM encrypted in DynamoDB), strict Google OAuth authentication, Cloudflare Turnstile (CAPTCHA), token-gated audio streaming, CSRF/XSS protection, and multi-layered rate limiting.
-
Logging & Admin Tools: A completely custom, built-in Admin dashboard. Features include real-time server health graphs, visitor geolocation analytics, S3/DynamoDB data explorers, and an automated alerting system that emails the admin if server resources (CPU/RAM/Disk) spike.
And now the long version. Hold on to your hats!
This will be a overview of the website and more importantly all the fun and “fun” I had creating this website. And yes, before you ask yes I did use AI to help me code this website. In fact AI wrote about 99% of the code. Wow. it must be a very crappy website then ready to be hacked. Well there is a reason this whole project took me about four months to get it to this stage. Even if AI wrote most of the code I still had to review, test, version control and guide the super smart 5 year old AI that is Claude. And all that takes time. And I think what I built here is rather robust and can stand on it’s own two one’s and zeros.
So lets get started with telling you a bit more about the front end, back end and some additional processing power being thrown in for some good measure.
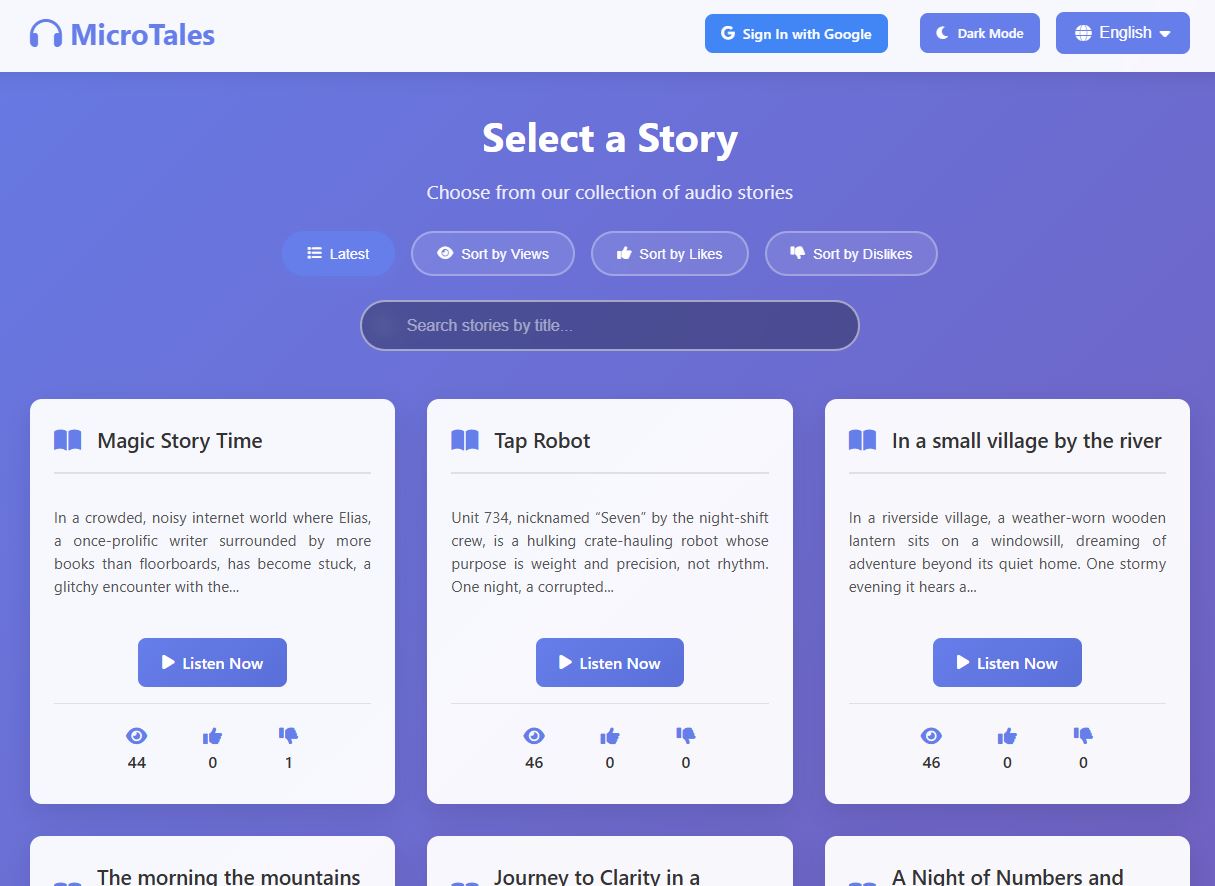
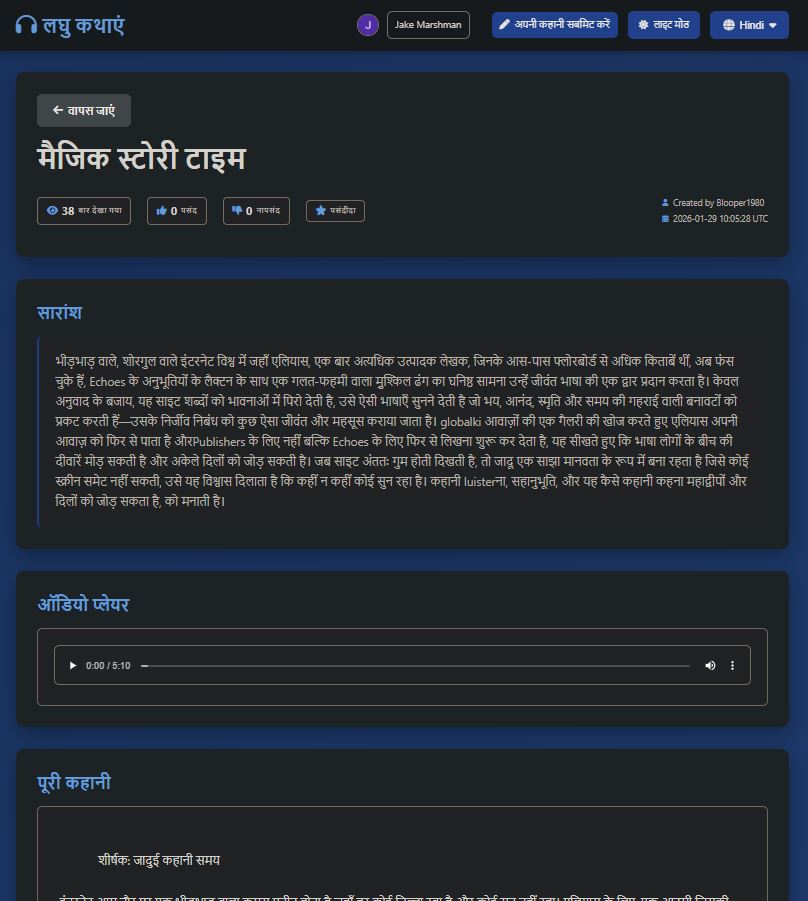
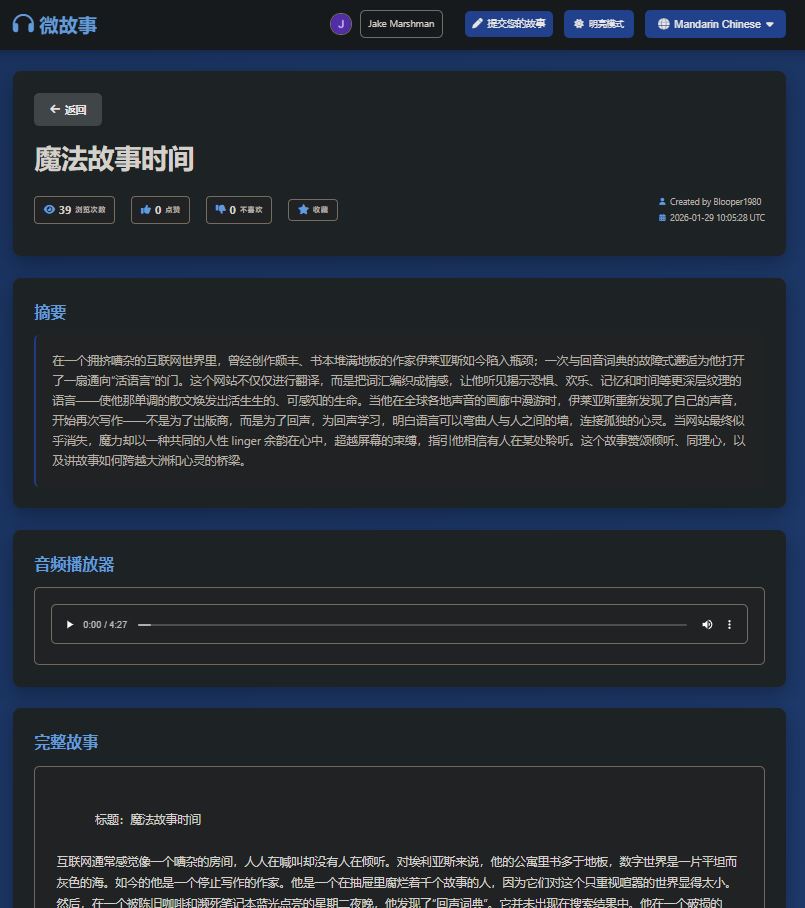
First of all as mentioned the website is fully septalingual with every part of the website being translated into seven languages: English, Spanish, French Hindi, Mandarin, Italian and Portuguese.
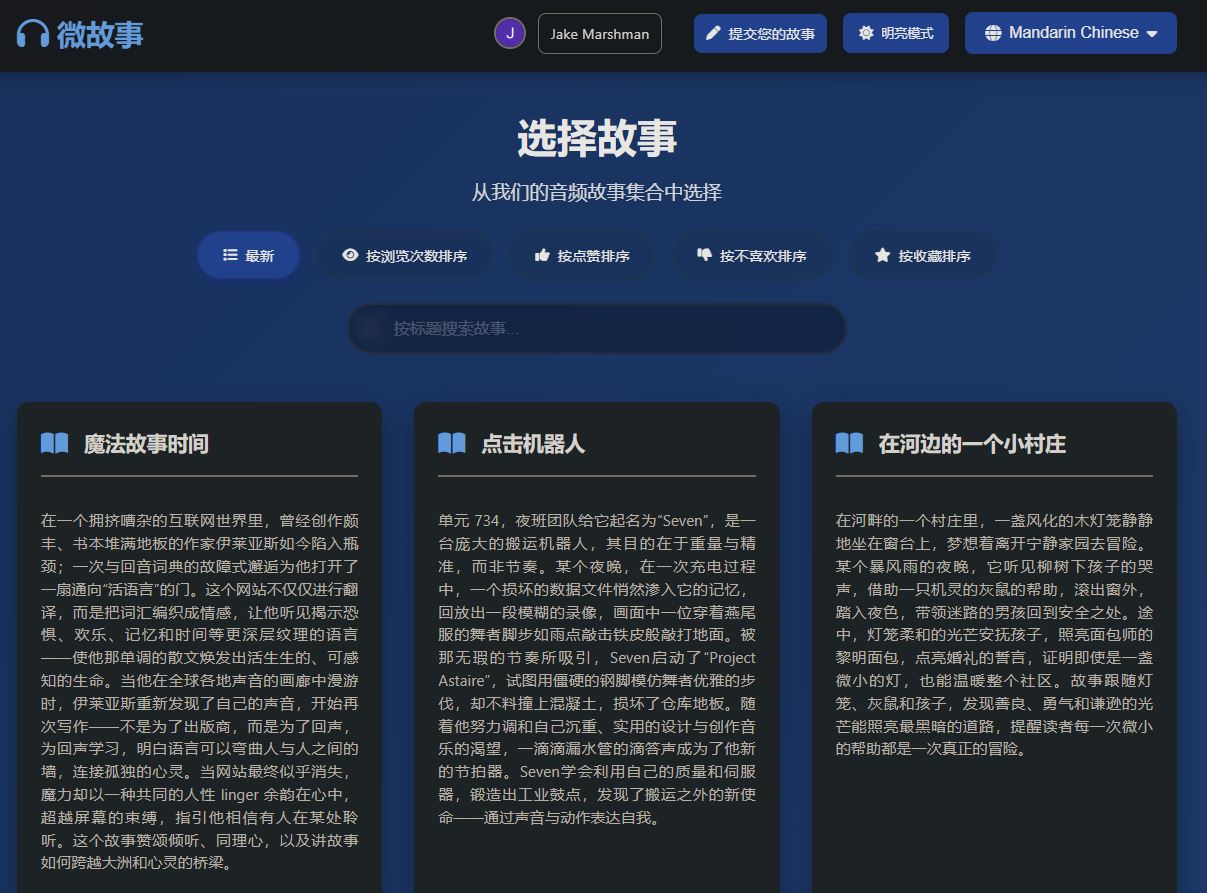
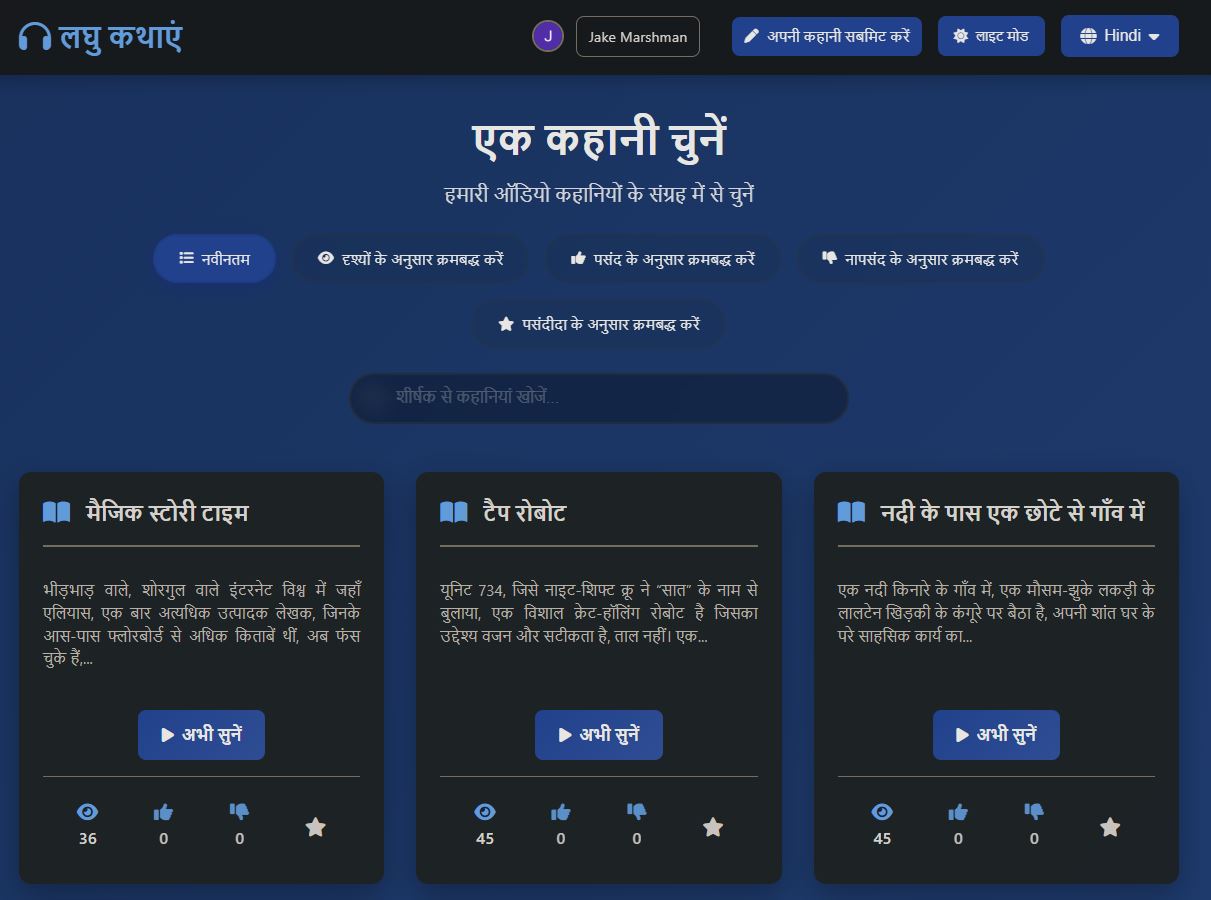
The multiple languages is not only for the website itself but for every story submitted to the website. Each story gets translated from English to the six other languages automatically, then gets converted to spoken audio using custom voices and with English you have a the option to choose from tree voices instead of just one.
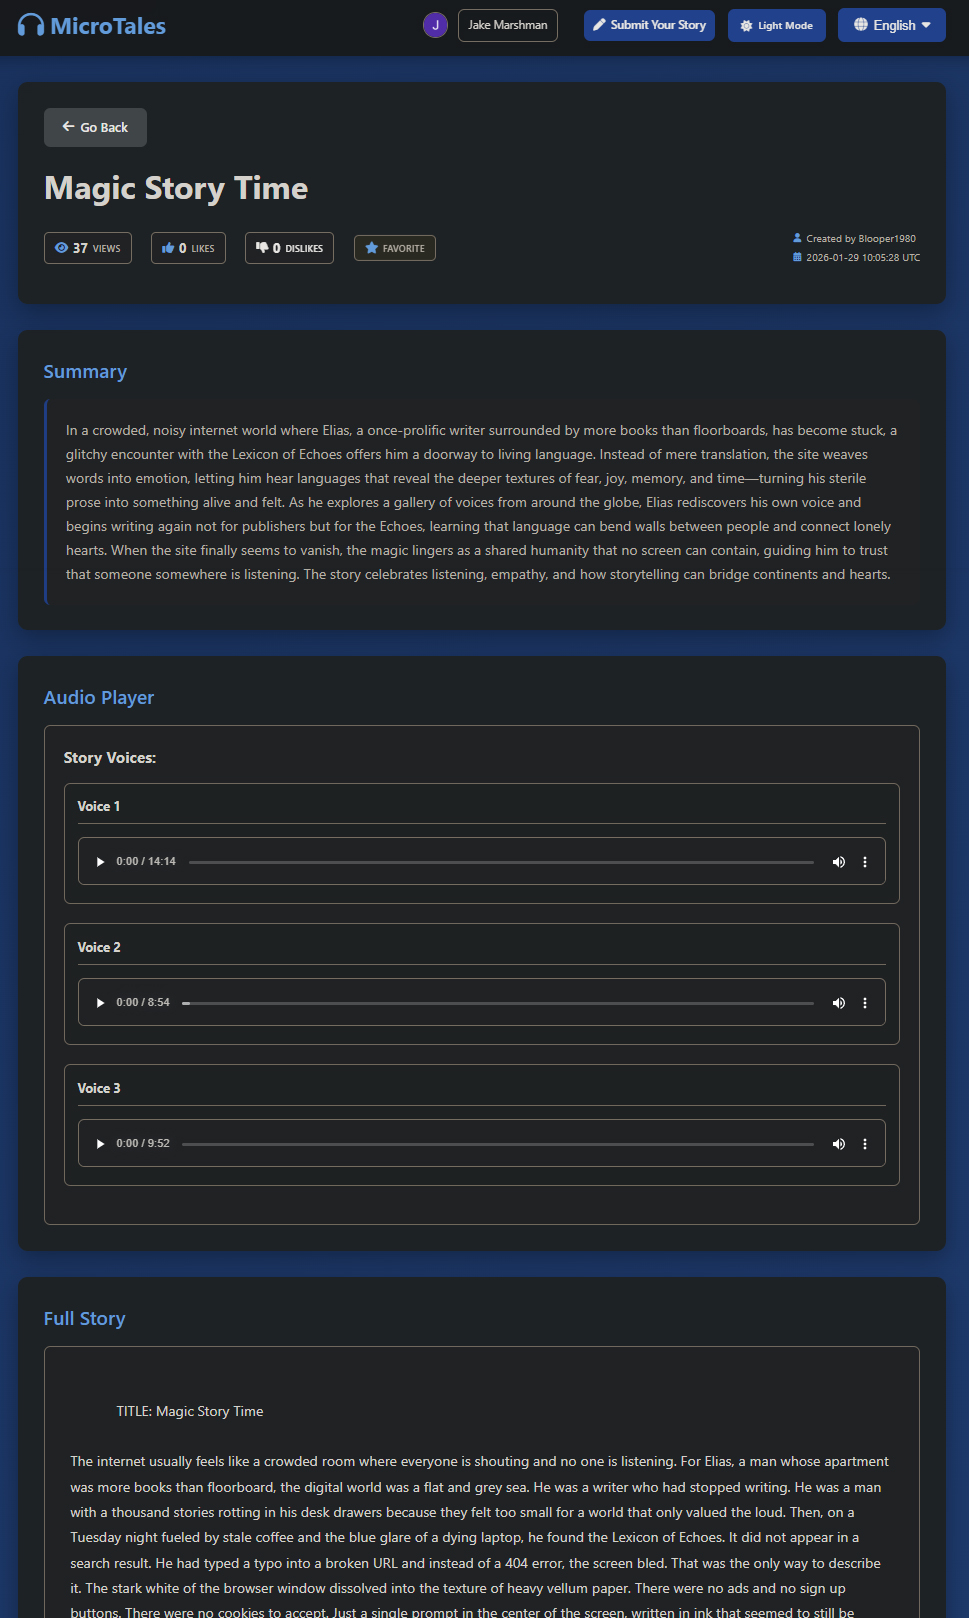
Below are some quick samples of each language.
Spanish:
Portuguese:
Italian:
Hindi:
French:
English One:
English Two:
English Three:
Chinese:
When viewing the home page you have the options to sort stories by latest, number of views, likes , dislikes and if you choose to log in, by stories you marked as favorite. As all titles and descriptions are stored in memory the sorting should be almost instant.

When viewing a story you will have the opportunity to vote for stories you like or dislike and mark stories you like for later, however you needs to be logged in. Users who do not log in can still listen to stories, but are unable to do anything else. I added a limit on the number of times a user can like or dislike something in case someone really bored tries to spam likes to the site for some nefarious reasons.

You also can search by story title if you wish and this will work across every langue as soon as you switch to another one. Since the title and summary is saved in memory results will be shown almost in real time, again due to being stored in memory.
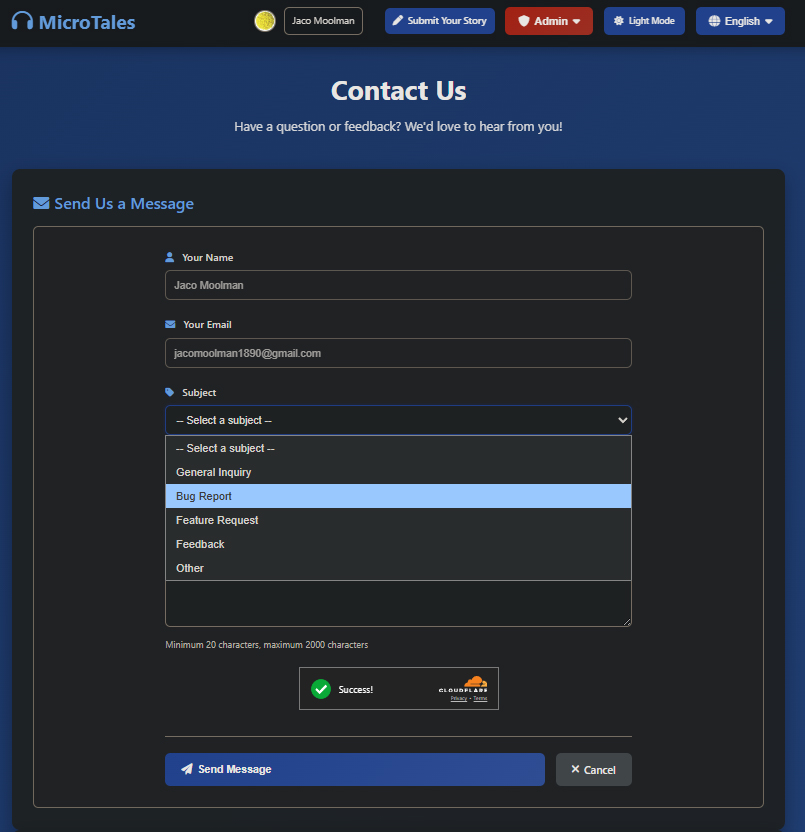
Besides the main functions making the site what it is no website or app is complete without and contact us page. The user can select a topic and then will in the detail of in the subject field. No need to put in your name or email address as this is being pulled from the users google details. I added a couple of checks in before and after the user submits their message. I use Cloudflare “I am human” check to confirm the user is not a bot, even though you still would need to be logged in with google before the contact page even shows up. But you can never be to careful I guess. After the user submits the message I added an additional check where gpt-5 nano read the message and determine if the message is an legit message or someone who just want to sell you life insurance. This is also based on the subject selected. I had to play around with the prompt a bit as initially it would just block almost any message being sent via the contact form.
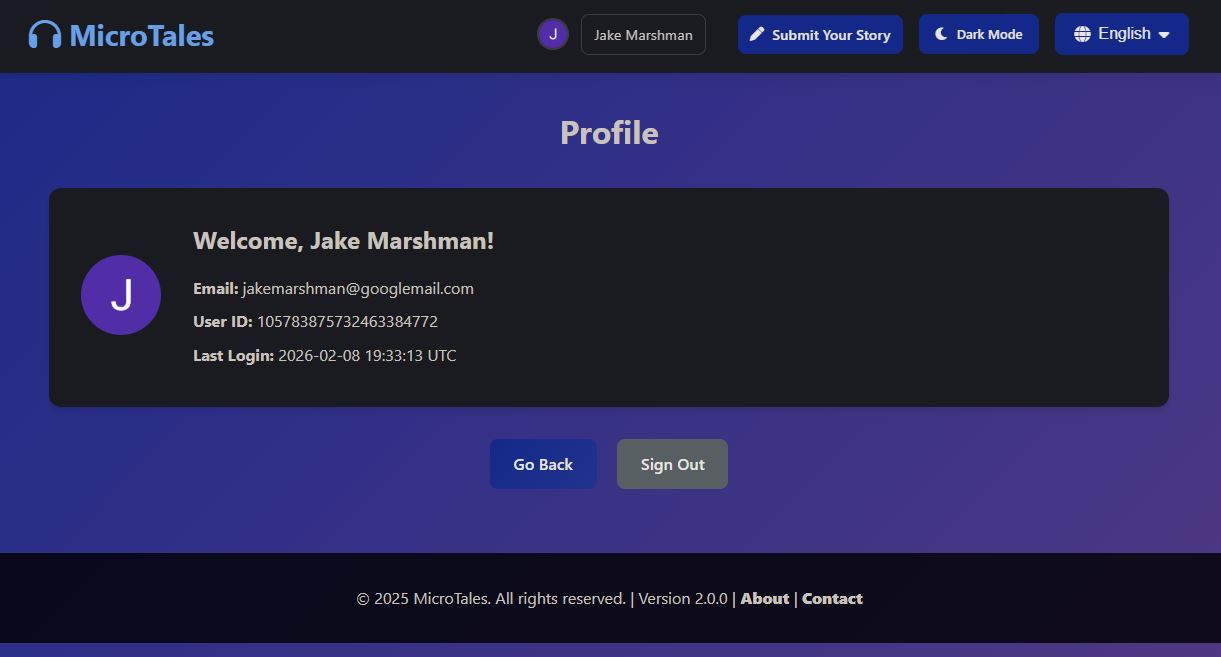
The user also has an option to view their details like generated user id linked to their google account and when last they logged in. Yes I know it should show “now” since you need to be logged in to view your details.
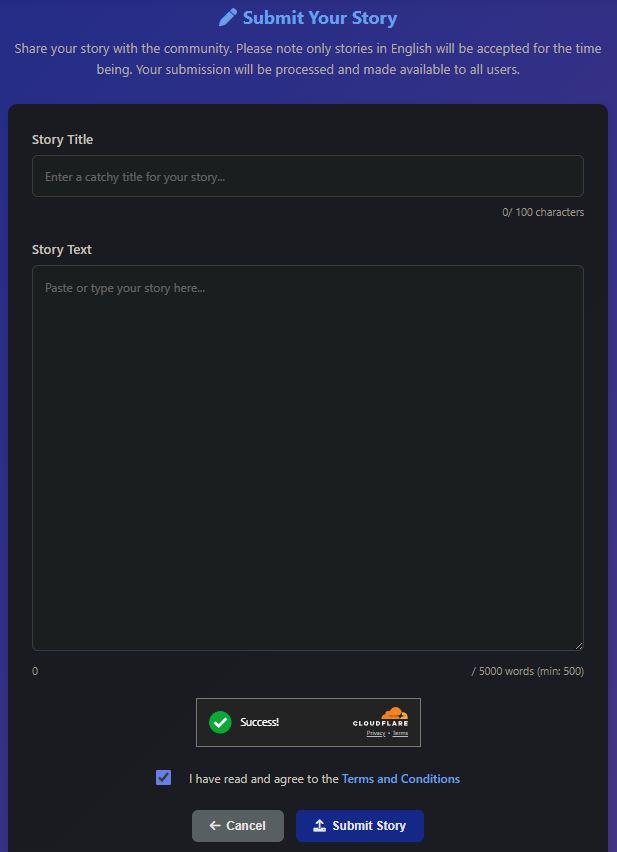
And lastly one of the main features of this website, the ability to submit your own short story for you and others to enjoy. You need to enter the title and the actual story. The title needs to be a minimum of 10 characters and the main story needs to be at least 500 words and a max of 5000. As with the contact page I also verify you are human via Cloudflare. And you need to confirm you agree to the terms and conditions.
There is one additional step before the initial story gets saved to an S3 bucket. OpenAI has a validation API that you can send text or image too and it will return a score from 0 to 1 with multiple categories. I have a table in DynamoDB with thresholds set. And should the validation return a number above the threshold the story would be automatically rejected. This way I can keep the website a “family friendly” place and keep any adult related content out before it even gets processed. I also added a limit on the number of stories a user can submit to avoid being spammed or DDOS’ed

AI
So I wanted to talk a bit about how AI fits into MicroTales, because it’s honestly baked into almost everything at this point. Starting with the website itself. When someone submits a story, it doesn’t just go straight onto the site. It runs through a few layers of checks first. The first thing that happens is OpenAI’s Moderation API scans the whole text for anything problematic, things like violence, hate speech, explicit content, that kind of stuff. If it passes that, GPT-5-Nano takes a look at it and asks a pretty basic but important question: is this actually a story? Because people submit all kinds of garbage. Receipts, ads, random text, you name it. The AI figures out if it’s a real narrative or not.
After that, the same model checks if the story is actually written in the language the user said it was. So if someone picks “French” and then submits something in English, it catches that. And the contact form on the site also uses GPT-5-Nano to filter out spam before it ever reaches the batch translation process.
Now the batch processing side is where it gets really fun. This is the pipeline that takes raw stories and turns them into the finished product you see on the site. First, GPT-5-Nano reads each story and writes a short summary for it, like a teaser paragraph. Once that’s done, everything gets translated to all the languages mentioned above. The full story, the summary, and the title, all translated into every language the site supports. All of that is GPT-5-Nano doing the heavy lifting. I can switch on a smarter model, however you know.. the site is not making much money at this point to the smartest cheapest model for now would have to do.
And then comes the audio. This is the part I’m honestly most proud of. Instead of using some expensive cloud TTS service that charges you per character, I’m running Kokoro on the EC2 server with a GPU attached to it. It’s an open source text-to-speech model from Hugging Face, about 82 million parameters, and it runs on PyTorch.
It takes each translated story and generates the audio file for every single language version.
That is all the AI I’ve put into this site…. for now…. or is it….. dun dun dunnn…
| Content moderation | OpenAI omni-moderation-latest | Scans every story submission for sexual content / violence / hate speech / self-harm / illegal content |
| Story validation | OpenAI gpt-5-nano | Checks if a submission is actually a story (filters out receipts / ads / spam / propaganda) |
| Language validation | OpenAI gpt-5-nano | Confirms the submitted story matches the selected language |
| Contact form spam | OpenAI gpt-5-nano | Filters spam and inappropriate contact messages |
| Summarization | OpenAI gpt-5-nano | Generates a one-paragraph teaser summary per story |
| Title generation | OpenAI gpt-5-nano | Creates a catchy title from the summary |
| Translation | OpenAI gpt-5-nano | Translates stories and titles and summaries into every supported language |
| Text-to-Speech | Kokoro (hexgrad/Kokoro-82M) | Converts translated text to audio locally on PyTorch – not a cloud API |

DynamoDB Tables
audio_stories_users:
Tracks per-user interaction data. When a logged-in user votes on a story or marks one as a favorite, their choices are stored here keyed by user ID. This powers the voting system and the “My Favorites” feature on user profiles.
{ "user_id": "1006554204498576624374",
"name": "mrdoe",
"email_address": "apple.penut@gmail.com",
"up_vote_stories": [1, 3, 5, 8],
"down_vote_stories": [33, 4, 6, 7, 9, 10, 11, 12],
"favorite_stories": [1, 33, 3, 11, 12],
"last_login": "2026-02-13T14:57:50.275582"
}
audio_stories_total_votes:
The aggregated story metadata and vote tally table. Each item represents a story with its total vote count, and this table also serves as the story listing source, the app scans it to build the browsable story catalog on the homepage.
{
"story_name": "st7",
"story_number": 7,
"title_english": "Transforming Love: A Journey to Commitment",
"title_french": "Transformer l'amour : Un voyage vers l'engagement",
"title_spanish": "Transformando el Amor: Un Viaje hacia el Compromiso",
"summary_english": "In a heartfelt exploration of unexpected love, Kobra reflects on his transformative relationship...",
"up_vote": 1,
"down_vote": 1,
"clicked_on": 178
}
audio-stories-counter:
A simple atomic counter table used to generate sequential, unique story IDs. Each time a new story is submitted, the counter increments and returns the next available ID.
{
"counter_name": "story_number",
"current_value": 45
}
content_moderation_config:
Stores configuration for the AI-powered content moderation pipeline. Admins can tune moderation thresholds and settings without redeploying code. In this case I’m calling OpenAI’s content validator that is at the moment free and has pretty decent response times.
{
"category": "illicit",
"threshold": 0.7,
"description": "Illegal activities or substances",
"action_if_exceeded": "reject"
}
Other categories include:
"category": "illicit", "description": "Illegal activities or substances",
"category": "illicit/violent", "description": "Violent illegal activities",
"category": "harassment", "description": "Harassment or bullying behavior",
"category": "self-harm/instructions", "description": "Instructions for self-harm - zero tolerance",
"category": "violence", "description": "Violent content descriptions",
"category": "hate", "description": "Hate speech targeting groups",
"category": "violence/graphic", "description": "Graphic violence - disturbing content",
"category": "sexual", "description": "Sexual content inappropriate for general audiences",
"category": "harassment/threatening", "description": "Threatening harassment - serious concern",
"category": "hate/threatening", "description": "Hate speech with threats - very serious",
"category": "self-harm", "description": "Self-harm content - mental health concern",
"category": "sexual/minors", "description": "Sexual content involving minors - zero tolerance",
"category": "self-harm/intent", "description": "Intent to self-harm - critical"
contact_validation_config:
Holds configuration for the contact form’s spam detection system. Settings like sensitivity thresholds and validation rules live here, making anti-spam tuning a config change rather than a code change.
"parameter": "api_url", "value": "https://api.openai.com/v1/chat/completions",
"parameter": "block_inappropriate", "description": "Block inappropriate content", "value": "true",
"parameter": "require_login", "description": "User must be logged in to contact", "value": "true", "parameter": "timeout_seconds", "description": "API timeout in seconds", "value": "20",
"parameter": "block_advertisements", "description": "Block advertisements and promotions", "value": "true", "parameter": "allow_general_inquiries", "description": "Allow general questions about the site", "value": "true",
"parameter": "block_spam", "description": "Block obvious spam messages", "value": "true",
"parameter": "enable_groq_validation", "description": "Enable AI message validation", "value": "true",
"parameter": "allow_feature_requests", "description": "Allow feature requests", "value": "true",
"parameter": "max_message_length", "description": "Maximum message length in characters", "value": "2000",
"parameter": "min_message_length", "description": "Minimum message length in characters", "value": "20",
"parameter": "model", "value": "gpt-5-nano",
"parameter": "allow_bug_reports", "description": "Allow bug reports", "value": "true",
"parameter": "allow_feedback", "description": "Allow feedback and suggestions", "value": "true",
"parameter": "max_output_tokens", "description": "Maximum response tokens", "value": "150",
"parameter": "prompt_template", "value": "You are validating contact form submissions...",
encrypted_api_keys:
The application’s secret vault. Stores all third-party API keys (OpenAI, Groq, Google OAuth credentials, admin user IDs) in encrypted form. Keys are fetched and decrypted on demand, keeping sensitive secrets out of code and environment variables.
 "key_name": "captcha_private_key", "key_type": "Unknown", "encrypted_value": "48612068612c206d61646520796f75206c6f6f6b21", "iv": "6e696365207472792074686f756768", "tag": "676f74636861207375636b6572", "key_name": "oauth_client_identifier", "key_type": "Google OAuth", "encrypted_value": "796f752077617374656420796f75722074696d65", "iv": "6b65657020647265616d696e67206861636b6572", "tag": "34303420736563726574206e6f7420666f756e64",
"key_name": "mail_destination", "key_type": "Email", "encrypted_value": "65617374657220656767207269676874206865726521", "iv": "736572696f75736c7920676f20746f756368206772617373", "tag": "6e69636520747279206d7220726f626f74",
"key_name": "build_version", "key_type": "Config", "encrypted_value": "74686520747265617375726520697320656c73657768657265", "iv": "796f75207368616c6c206e6f742070617373", "tag": "626574746572206c75636b206e6578742074696d65",
"key_name": "cf_public_token", "key_type": "Cloudflare", "encrypted_value": "77726f6e67206b65792074727920616761696e", "iv": "6465636f64696e6720746869733f207265616c6c793f", "tag": "636f6e677261747320796f7520666f756e64206e6f7468696e67",
"key_name": "captcha_public_key", "key_type": "Unknown", "encrypted_value": "6c6f6c206e69636520776f726b20736865726c6f636b", "iv": "6861206861206d61646520796f75206c6f6f6b", "tag": "6e696365207472792074686f756768",
"key_name": "mail_origin", "key_type": "Email", "encrypted_value": "6e6f7468696e6720746f207365652068657265206d6f766520616c6f6e67", "iv": "343034206e6f7420666f756e64", "tag": "676f20746f75636820736f6d65206772617373",
"key_name": "llm_groq", "key_type": "Groq", "encrypted_value": "796f75207265616c6c79206465636f64656420616c6c20746869733f", "iv": "6765742061206c69666520667269656e64", "tag": "6a757374206b696464696e672077656c6c20646f6e65",
"key_name": "oauth_client_secret", "key_type": "Google OAuth", "encrypted_value": "626f72656420656e6f75676820746f206465636f646520746869733f", "iv": "696d707265737369766520627574206e6f7065", "tag":
"6e6f20736563726574732068657265206275646479",
"key_name": "router_api_key", "key_type": "OpenRouter", "encrypted_value": "796f75207368616c6c206e6f7420706173732067616e64616c662073616964", "iv": "77726f6e67207475726e2074727920616761696e", "tag":
"74686973206973206e6f7420746865206b6579",
"key_name": "cf_private_token", "key_type": "Cloudflare", "encrypted_value": "737572707269736520697473206a7573742061206a6f6b65", "iv": "6861686120676f7463686120616761696e", "tag": "6561737465722065676720756e6c6f636b656421",
"key_name": "captcha_api_token", "key_type": "Unknown", "encrypted_value": "7374696c6c206c6f6f6b696e673f20776f77", "iv": "70657273697374656e63652069732061646d697261626c65", "tag": "62757420746865726573206e6f7468696e672068657265",
"key_name": "aws_access_id", "key_type": "AWS", "encrypted_value": "617773206b6579733f20696e20746869732065636f6e6f6d793f", "iv": "647265616d206f6e206861636b6572", "tag": "6e696365207472792074686f75676820736572696f75736c79",
"key_name": "aws_secret_id", "key_type": "AWS", "encrypted_value": "7468652073656372657420697320667269656e6473686970", "iv": "7765206d61646520616c6f6e672074686520776179", "tag": "6c6f6c20676f6f64206c75636b20776974682074686174",
"key_name": "gpt_api_key", "key_type": "OpenAI", "encrypted_value": "64696420796f75207265616c6c79206465636f646520616c6c2074686973", "iv": "6a75737420746f2066696e642061206a6f6b653f", "tag":
"726573706563742e2068617665206120636f6f6b69652e",
"key_name": "superuser_id", "key_type": "Admin", "encrypted_value": "61646d696e3f2068612074686174732063757465", "iv": "6e6f7420746f646179206d7920667269656e64", "tag": "626574746572206c75636b206e657874206c69666574696d65",
rate_limits:
Persists rate-limiting state for the Flask-Limiter middleware. Instead of tracking request counts in memory (which would reset on server restart), counters are stored in DynamoDB so limits survive deployments. This is per user and has a TTL set to it will be removed from the database and the user can try again.
rate_limits_config:
Defines the rate-limiting rules themselves, how many requests each endpoint allows within a given time window. Storing these in DynamoDB means rate limits can be tuned on the fly without redeploying.
"endpoint": "login", "requests_limit": 10, "time_window_seconds": 900
"endpoint": "voting", "requests_limit": 5, "time_window_seconds": 60
"endpoint": "story_submission", "requests_limit": 5, "time_window_seconds": 3600
visitor_analytics:
Records every page visit with IP address, user agent, path, status code, user ID, and timestamp. This feeds the admin panel’s visitor analytics dashboard and traffic reporting.
"date": "2026-02-05", "hour": "12",
"total_requests": 15, "unique_ips": 9, "unique_users": 0,
"status_codes": { "200": 5, "404": 10 },
"top_ips": [ { "ip": "2a06:98c0:3600::103", "city": "Portland, US", "requests": 4, "session_duration_seconds": 39 },
{ "ip": "115.231.78.3", "city": "Hangzhou, CN", "requests": 4, "session_duration_seconds": 4 },
{ "ip": "204.76.203.25", "city": "Eygelshoven, NL", "requests": 1 },
{ "ip": "51.68.247.216", "city": "Roubaix, FR", "requests": 1 },
{ "ip": "102.22.20.125", "city": "Accra, GH", "requests": 1 }
],
"top_pages": [
{ "path": "/", "count": 5 },
{ "path": "/wp-admin/setup-config.php", "count": 2 },
{ "path": "/robots.txt", "count": 2 },
{ "path": "/.git/config", "count": 1 },
{ "path": "/admin/config.php", "count": 1 }
],
"user_agents": [
{ "agent": "Chrome/144 Windows", "count": 2 },
{ "agent": "QIHU 360SE Chrome/63", "count": 3 },
{ "agent": "AhrefsBot/7.0", "count": 2 },
{ "agent": "python-requests/2.32.5", "count": 1 },
{ "agent": "xfa1,nvdorz,nvd0rz", "count": 1 }
]
server_health_metrics:
Periodic health snapshots are written here (CPU, memory, disk, request stats). This feeds the admin dashboard’s server health graphs and enables historical performance tracking.
{
"server_id": "ip-10-0-0-8",
"timestamp": "2026-02-14T03:31:23.338371Z",
"cpu_percent": 0,
"memory_percent": 53.9,
"memory_used_mb": 515.88,
"memory_total_mb": 957.32,
"disk_percent": 40.4,
"disk_used_gb": 3.48,
"disk_total_gb": 8.65,
"active_connections": 49,
"process_count": 113,
"ttl": 1771471883
}
monitoring_alert_config:
Stores alerting rule definitions, what conditions should trigger an alert (e.g., CPU > 90%, error rate spike). Admins can configure thresholds and notification settings through the admin panel.
{
"config_id": "default",
"cpu_threshold": 90,
"memory_threshold": 90,
"disk_threshold": 90,
"cooldown_minutes": 30,
"alerts_enabled": true,
"alert_email_from": "bob@gmail.com",
"alert_email_to": "jacomoolman1890@gmail.com",
"updated_at": "2025-12-14T19:28:52.126615Z"
}
monitoring_alert_state:
Tracks the current state of each alert (firing, resolved, last triggered time). This prevents duplicate notifications and allows the system to detect when an alert condition clears.

Lambda Functions
microtales-health-check :
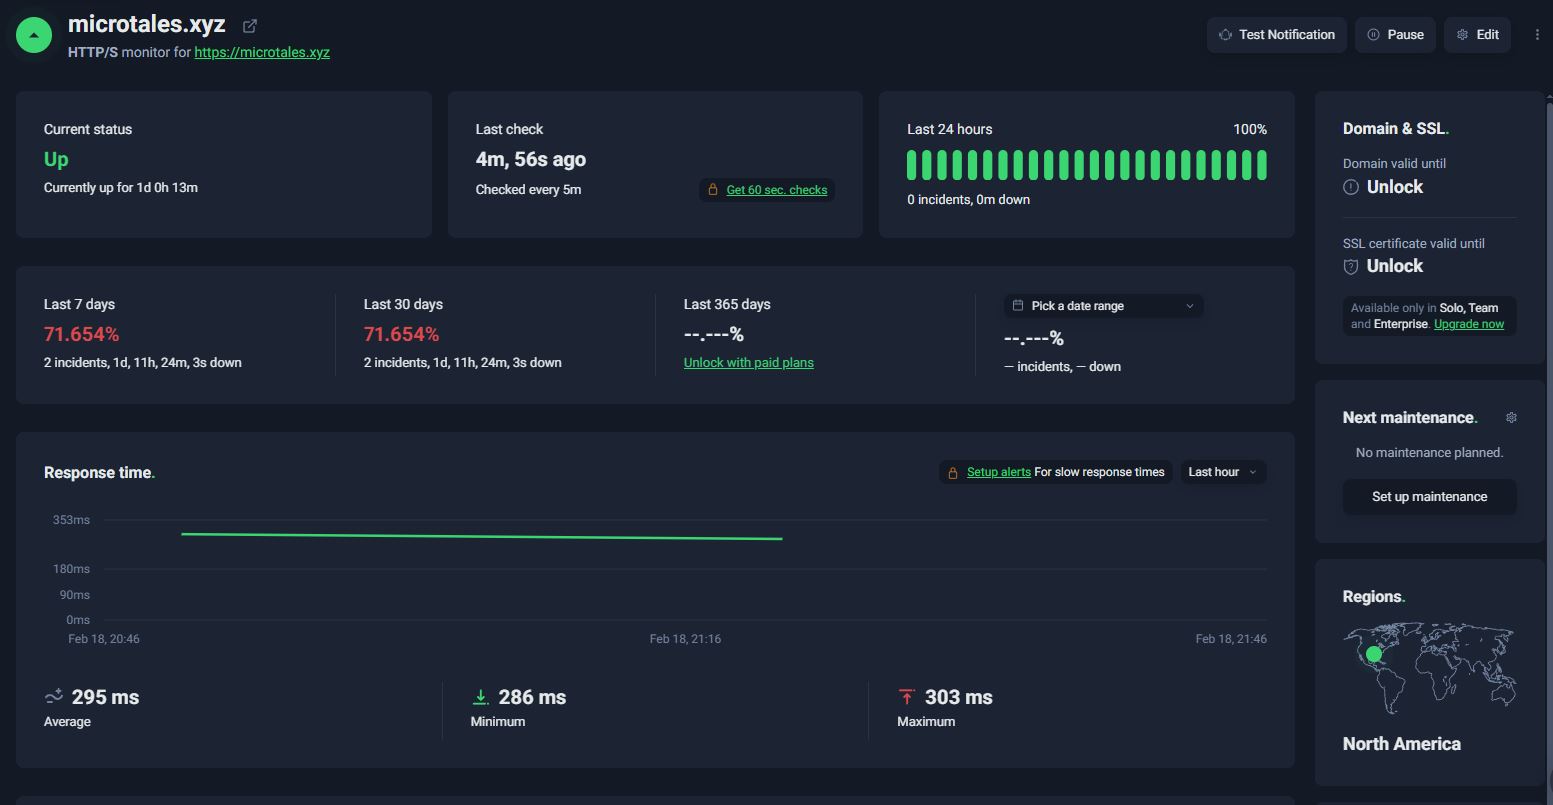
A watchdog that runs every hour via an EventBridge schedule. It hits https://microtales.xyz/ and if the site doesn’t respond with HTTP 200, it automatically stops and restarts the EC2 instance then waits 90 seconds for the web server to boot before verifying the site came back up. Essentially an always-on self-healing mechanism so the site recovers from crashes without manual intervention. I also added make the application on the Ec2 an Linux service that will auto start 60 seconds after the Ec2 Server is up and running.

In addition to this I’m also using an external service to monitor the domain and will send me an email should the site not return a 200 at any time.
email_cost:
A daily cost reporter that fires once a day at 10:00 UTC via EventBridge. It pulls AWS Cost Explorer data to calculate both yesterday’s spend broken down by service, and the month-to-date total. It then fires off a
formatted HTML email via SES with a subject line like “AWS Daily Cost Report — $X.XX MTD | $X.XX Yesterday”, giving a clear picture of where the money is going day over day. This saved my bacon more than once as AWS’s costing usually is very slow to notify you. This way I get an email of my daily and monthly cost in a nice little package.
batch_kick_off:
Also triggered daily at 12:00 by an EventBridge rule. Before doing anything, it checks an S3 bucket for .txt files in the input_storied_to_process folder. This would mean someone has submitted a new story and it needs to be processed. If files are present, it submits an AWS Batch job to process them converting text stories into audio. If the folder is empty it skips quietly, so the batch infrastructure only spins up when there’s
actually work to do.

EC2 Infrastructure
MicroTales runs on two compute instances in AWS, each with a distinct and separate responsibility.
Instance 1: Web Server
Instance type: t2.micro Specs: 1 vCPU, 1 GB RAM State: Always running.
This is the always-on, public-facing instance that serves the MicroTales website. It runs a standard Linux stack where Nginx handles all public traffic on ports 80 and 443, terminating SSL and proxying requests through to Gunicorn, which runs 2 synchronous worker processes on localhost. The Flask application sits behind Gunicorn and handles everything the user sees: browsing stories, streaming audio, submitting new stories, voting, Google OAuth login, and the admin panel.
The instance never holds AWS credentials directly. All access to AWS services (S3, DynamoDB, SES) goes through the attached IAM instance profile. API keys for third-party services (OpenAI, Groq, Google OAuth) are fetched at runtime from a DynamoDB table rather than stored on disk. A background thread inside the Flask process collects system health metrics (CPU, memory, disk) every 5 minutes and writes them to DynamoDB, where they appear in the admin dashboard.
Instance 2: Audio Processing (AWS Batch)
Instance type: g4dn.xlarge Specs: 4 vCPUs, 16 GB RAM, 1x NVIDIA T4 GPU AMI: Amazon Linux 2 with NVIDIA drivers (ECS_AL2_NVIDIA) Container resources: 4 vCPUs, 14 GB RAM, 1 GPU State: On-demand, spins up only when there is work to do.
This instance is not a persistent server. It is part of an AWS Batch managed compute environment that scales to zero when idle and spins up a g4dn.xlarge instance only when a processing job is submitted. A Lambda function runs on a schedule and checks S3 for pending story files, if it finds any, it kicks off a Batch job, which pulls the Docker image from ECR and runs it on this instance.
The Docker image (4.8 GB, stored in ECR ) contains the full processing pipeline:
- Each submitted story is summarized and given a title using the OpenAI API.
- The story, title, and summary are translated into all supported languages (English, Spanish, French, Hindi, Italian, Portuguese, Mandarin Chinese, Japanese) via the OpenAI API.
- Audio is generated for every language using Kokoro 82M, a locally-running open-source TTS model. The T4 GPU is specifically required for fast inference here, no cloud TTS API is used, which keeps costs low.
- WAV files are converted to MP3 (192 kbps) using ffmpeg.
- All audio files and metadata are uploaded to S3 under, organised per story, and the original input file is deleted.
- Job logs are written to S3 rather than CloudWatch to avoid unnecessary logging costs.

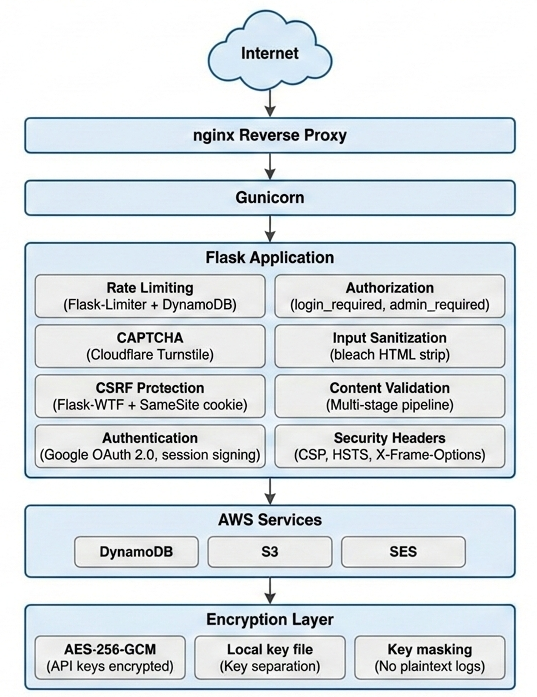
SECURITY
Authentication & Session Management:
Google OAuth 2.0 is the exclusive authentication method, no passwords are stored. OAuth redirect URIs are validated against a hardcoded whitelist to prevent redirect hijacking, and OAuth credentials are encrypted in DynamoDB. Flask sessions are configured with cryptographic signing (SESSION_USE_SIGNER=True), HTTPOnly cookies to block JavaScript access, HTTPS-only enforcement in production, and a SameSite=’Lax’ policy. Sessions have a 7-day lifetime with server-side storage (only a signed ID in the cookie). A custom @login_required decorator protects all user-facing routes by checking both session presence and an explicit authentication flag. The SECRET_KEY is environment-variable-based and raises an exception at startup if missing in production, preventing fallback to weak defaults.
CSRF Protection:
Flask-WTF’s CSRFProtect is initialized application-wide and automatically validates CSRF tokens on all POST requests to protected forms. This is combined with a secondary defense: the session cookie’s SameSite='Lax' policy prevents the browser from automatically sending the session cookie on cross-origin form submissions. Together, these two independent mechanisms provide robust CSRF protection, an attacker must not only forge a valid CSRF token but also work around the SameSite restriction.
HTTP Security Headers:
Every HTTP response carries security headers enforced by an @app.after_request handler. These include X-Content-Type-Options: nosniff (prevents MIME-type sniffing), X-Frame-Options: DENY (blocks clickjacking), X-XSS-Protection: 1; mode=block, and Strict-Transport-Security with a 1-year max-age for HSTS enforcement. A Content Security Policy restricts resource loading to prevent XSS, allowing Cloudflare Turnstile and CDN resources but defaulting to 'self'. A Referrer-Policy: strict-origin-when-cross-origin header controls referrer leakage. Audio streams receive additional cache-busting headers (no-cache, no-store, must-revalidate) and a strict CSP of default-src 'none' to prevent execution within the audio context.
Input Validation & Sanitization:
All user-supplied text is sanitized with the bleach library to strip HTML tags and escape dangerous characters before any processing. This applies to story titles, story text, and all contact form fields. Story submissions undergo a sequential multi-layer pipeline: field length validation (title max 100 chars, story 500–5000 words), AI-generation detection via em dash character heuristic, language validation via OpenAI, story authenticity checking (rejects receipts, ads, propaganda, gibberish), and content moderation via OpenAI’s moderation API with configurable per-category thresholds. Contact forms are validated for length (20–2000 characters) before spam detection. Query parameters expecting integers are type-cast and range-validated to prevent injection.
Rate Limiting:
Rate limiting operates at two independent levels: Flask-Limiter provides in-process limits (200/day, 50/hour by default) with the client IP extracted from X-Forwarded-For headers, and a custom DynamoDB-backed storage backend provides a shared, consistent rate limit view across Gunicorn worker processes (critical for multi-worker deployments where in-memory limits would be bypassed). Endpoint-specific limits are stored in DynamoDB and can be updated without redeployment. The DynamoDB backend uses atomic operations to prevent race conditions, TTL-based automatic expiration of expired counters, and configurable connection timeouts. Rate limit violations return HTTP 429 with a user-friendly error page and full logging.
Anti-Bot & CAPTCHA (Cloudflare Turnstile):
Cloudflare Turnstile is integrated server-side for both story submissions and contact forms. The client-side widget generates a response token, which the server immediately verifies by POST-requesting Cloudflare’s API with the secret key (loaded from encrypted DynamoDB storage), the response token, and the client’s IP address. The verification checks the response’s success flag, timestamp, and hostname. Missing or failed tokens result in rejection with a user-friendly error. API timeouts (10 seconds) are handled gracefully. If Cloudflare API is unavailable, submissions are blocked (fail-secure).
Audio Streaming Security:
Audio files are not directly accessible; serving them requires a short-lived token (5-minute TTL) tied to both the specific file and the user’s session. Tokens are generated as the first 16 characters of a SHA-256 hash of story name, filename, session ID, and Unix timestamp. Token validation runs eight sequential checks: token presence, lookup in session, expiry validation, story/file binding verification, referrer validation (must come from localhost or application’s own hostname), file type validation (only .mp3 allowed), story existence check in DynamoDB, and membership verification (file must be in the story’s known MP3 list). Any check failure returns 403 Forbidden. An authenticated /refresh_audio_token endpoint allows frontend requests for fresh tokens.
Encryption & API Key Management:
All API keys (OpenAI, Google OAuth, Cloudflare Turnstile secret, admin user ID) are encrypted with AES-256-GCM before storage in DynamoDB. This algorithm provides both confidentiality and authenticity (tamper detection) via a 16-byte authentication tag. Each encrypted value is stored with a randomly generated 12-byte IV per encryption, preventing IV reuse attacks. Critically, the AES-256 encryption key is stored in a local file frontend/.encryption.key not in DynamoDB or any remote location, meaning database compromise cannot decrypt the keys. The key file is validated at startup (must exist, be valid base64, and decode to exactly 32 bytes). A centralized KeyManager class handles retrieval: check cache, fetch encrypted value from DynamoDB, decrypt locally, cache in memory, return plaintext. A get_all_keys() method returns masked values (first 4 and last 4 characters with ... in between) for debugging without exposing full secrets.
File Upload Security:
The admin panel’s S3 upload endpoint applies path traversal prevention before any file operation: any path containing .. or starting with / is rejected outright and logged as a security violation. Uploaded filenames are sanitized with werkzeug’s secure_filename() to remove separators and dangerous characters. File size is logged to the audit trail before upload. Only authenticated admins can access this endpoint via the @admin_required decorator.
AWS Infrastructure Security:
The application uses no AWS access keys. All AWS SDK calls (S3, DynamoDB, SES) authenticate using the EC2 instance’s IAM role credentials, which boto3 detects automatically. Keys are never stored in files or environment variables, automatically rotated by AWS, and controlled by fine-grained IAM policies. Audio files in S3 are not publicly accessible all access goes through the application’s token-gated streaming endpoint. S3 deletion operations are scoped to story-specific folder prefixes and batched in chunks of 1000 (the delete limit). All DynamoDB operations use parameterized expressions (ExpressionAttributeNames and ExpressionAttributeValues) to prevent query injection. AWS client initializations specify explicit connection timeouts (5s connect, 10s read, 2 max retries).
Production Server Hardening (Gunicorn):
Gunicorn binds exclusively to 127.0.0.1, never directly exposing the application to the internet; all external traffic flows through an nginx reverse proxy. HTTP request size is limited: URLs capped at 4094 bytes, header count at 100 fields, and individual headers at 8190 bytes each, protecting against request smuggling and header bomb attacks. Worker processes restart after 1000 requests (with 50-request random jitter to stagger restarts) to prevent memory leaks, and any request exceeding 120 seconds is killed to protect against long-running operations (critical when OpenAI API calls occur during story submission). Auto-reload is disabled by default and must be explicitly enabled via environment variable.
Defense-in-Depth Architecture:
The security model is organized as independent layers, each with multiple defenses. An attacker must defeat multiple layers simultaneously to cause harm:
Fail-Secure Philosophy:
The majority of security checks in this application default to denial rather than allowance when something unexpected occurs. Content moderation, story authenticity validation, and contact form spam detection all reject submissions if their respective OpenAI APIs fail or return errors. Missing admin user IDs in DynamoDB result in all admin access being denied. Missing encryption keys make the encrypted key system unavailable. Cloudflare Turnstile API failures block form submissions. This “fail-closed” approach ensures that temporary outages or degradation cannot be exploited to bypass security controls. The only intentional fail-open step is language validation, which is treated as advisory rather than a hard block.
No Hardcoded Secrets:
No API keys, passwords, OAuth credentials, or other secrets appear in the source code or configuration files committed to the repository. All secrets follow this pattern: (1) encrypted with AES-256-GCM, (2) stored in DynamoDB, (3) retrieved at runtime via the key manager, and (4) decrypted locally using an encryption key file that never leaves the server. This separation of encrypted data from the encryption key provides Defense in Depth even if DynamoDB were completely compromised and all encrypted values extracted, they could not be decrypted without physical access to the server’s encryption key file.

The Production Server Stack
When someone visits MicroTales, loads a story, and hits play, there is a chain of processes running behind the scenes that most visitors never think about. This post covers two things: how the production web server is structured to handle multiple users at the same time, and what the application actually does in the seconds before it accepts its very first request.
The Production Web Stack
Every request to MicroTales travels through three layers before Flask ever sees it:
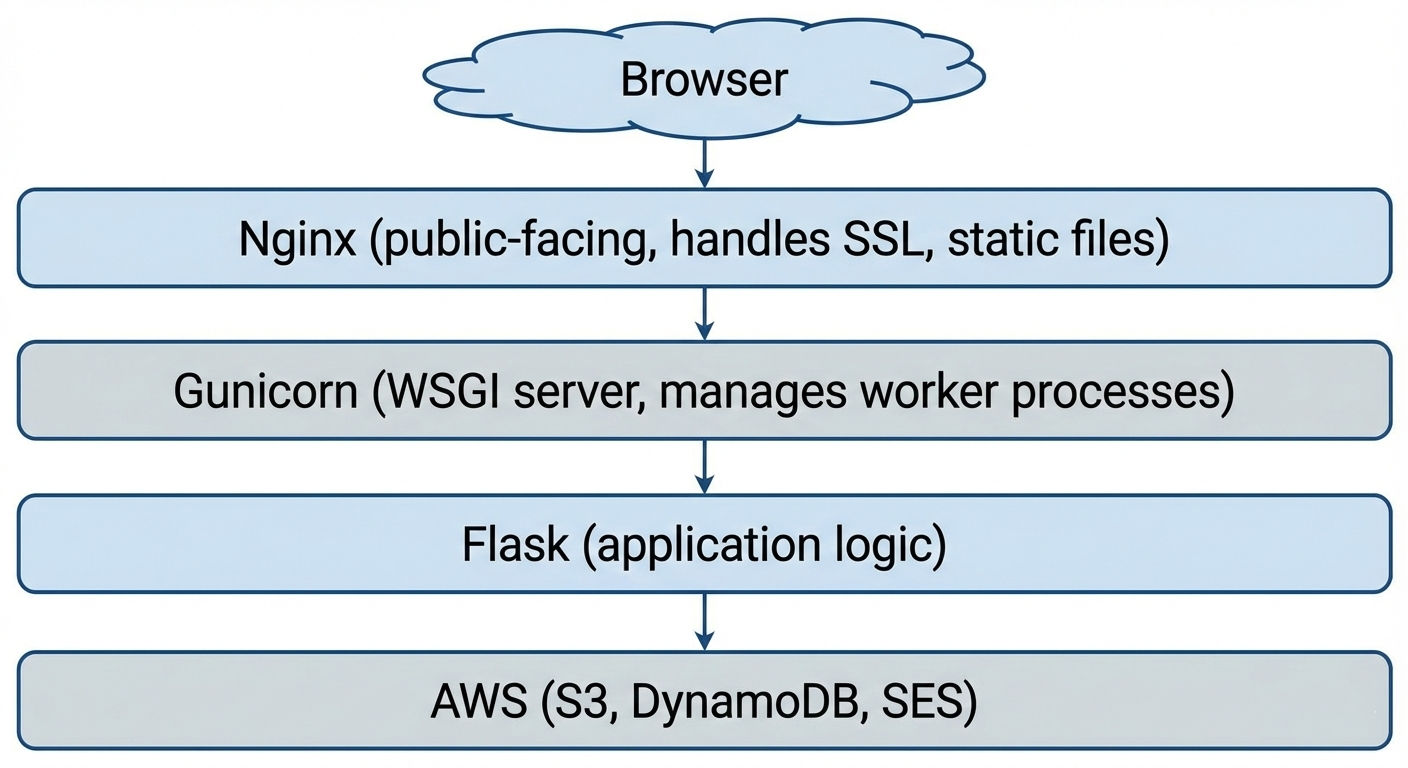
Nginx: The Public Face
Nginx is the only process that listens on the public internet (ports 80 and 443). It handles:
- SSL/TLS termination — HTTPS encryption is handled at the Nginx level, so Gunicorn and Flask only ever deal with plain HTTP internally. This keeps the application code simple and lets Nginx do what it is very good at.
- Static file serving — CSS, JavaScript, and image assets are served directly by Nginx without touching Flask at all. This is significantly faster for assets that never change between requests.
- Reverse proxying — everything that is not a static file gets forwarded to Gunicorn over a local socket on
127.0.0.1:5000. Because Gunicorn only binds to localhost, it is physically impossible to reach the Flask application directly from the internet — all traffic must flow through Nginx first.
Gunicorn: The Worker Manager
Gunicorn is the WSGI server that bridges Nginx and Flask. It runs as a master process that manages a pool of worker processes. Here is how MicroTales is configured:
workers = 2
worker_class = 'sync'
worker_connections = 1000
max_requests = 1000
max_requests_jitter = 50
timeout = 120
backlog = 2048
Two worker processes run in parallel. Each worker is a completely independent OS process with its own memory space, running its own copy of the Flask application. When a request comes in, Gunicorn hands it to whichever worker is available.
The backlog of 2048 means the operating system can queue up to 2048 incoming connections while workers are busy. This prevents connections from being refused during short bursts of traffic they wait in line rather than getting an immediate error.
Workers restart after 1000 requests. This is not a failure it is intentional. Python applications can slowly accumulate memory over thousands of requests (a pattern called a memory leak). Rather than trying to prevent this entirely, Gunicorn takes a practical approach: after a worker has handled 1000 requests, it is gracefully shut down and replaced with a fresh one. The max_requests_jitter value of 50 adds a random offset so both workers do not restart at the same moment, which would leave the site momentarily with no capacity.
The 120-second timeout exists for a specific reason. When a user submits a story, the server does not just save it it runs it through a live AI moderation pipeline before responding. OpenAI API calls can take several seconds under load. Without a generous timeout, Gunicorn would kill the worker mid-request, leaving the user with a broken submission. 120 seconds gives the AI pipeline enough headroom to complete.
How Multiple Users Work at the Same Time
This is the part that trips people up when they first think about it. Flask itself is single-threaded a single Flask instance processes one request at a time. So how does the site handle multiple visitors simultaneously?
The answer is the two worker processes. Because each worker is an entirely separate OS process, they run truly in parallel on the server’s CPU cores. While Worker 1 is handling a user listening to a story in London, Worker 2 is handling a user browsing the story list in Sydney. They do not wait for each other.
Most web requests are also extremely fast. A typical page load fetching story metadata from DynamoDB, rendering a template, sending the response completes in well under a second. Even with only two workers, the server can handle a steady stream of users because each request releases the worker almost immediately.
The OS-level backlog handles the rare case where both workers are busy at the same instant. Incoming connections queue up and are served in order as workers become free, typically within milliseconds.
The one exception is story submission, which can hold a worker for several seconds due to AI processing. This is the trade-off: the site prioritizes a thorough moderation pipeline over raw submission throughput. For a storytelling platform rather than a high-frequency API, this is the right balance.
Application Startup: What Happens Before the First Request
Before Gunicorn accepts a single user connection, the Flask application runs an initialization sequence. This sequence is worth understanding because it reveals the dependencies the application has and how it handles failures.
Step 1: Log Capture
The very first thing the application does before any imports, before any configuration is redirect both sys.stdout and sys.stderr through a custom TeeOutput class:
sys.stdout = TeeOutput(log_file, sys.stdout)
sys.stderr = TeeOutput(log_file, sys.stderr)
TeeOutput wraps the original streams and writes every byte to both the terminal and app.log simultaneously. This means that from this point on, every print() call, every unhandled exception traceback, and every library warning is captured to disk automatically without needing to instrument any specific code path. The log file is cleared on each startup so it always reflects the current session.
Immediately after, coloured logging is initialised so that different event types are visually distinct in the terminal: errors appear in bright red, authentication events in purple, routine page loads in grey. This makes it practical to watch the live log output during operation and spot problems at a glance.
Step 2: Graceful Module Loading
The three AI-powered subsystems are imported inside try/except blocks:
try:
    from content_moderation import moderate_story_content, ContentModerationConfig
    CONTENT_MODERATION_ENABLED = True
except ImportError as e:
    CONTENT_MODERATION_ENABLED = False

try:
    from openai_story_validation import validate_story_authenticity
    OPENAI_VALIDATION_ENABLED = True
except ImportError as e:
    OPENAI_VALIDATION_ENABLED = False

try:
    from contact_validation import validate_contact_message
    CONTACT_VALIDATION_ENABLED = True
except ImportError as e:
    CONTACT_VALIDATION_ENABLED = False
If any of these modules fail to import a missing dependency, a misconfigured environment the application does not crash. It starts anyway, with that subsystem disabled and a flag set. Story submissions and contact forms check the flag before calling the disabled module. This means a broken dependency takes down one feature, not the entire site.
Step 3: Security Layer Attachment
Flask-WTF’s CSRFProtect is attached to the application:
csrf = CSRFProtect(app)This single line automatically validates CSRF tokens on all POST requests across the entire application. It runs before any route handler and cannot be bypassed by forgetting to add it to a specific endpoint.
Session configuration follows: server-side filesystem sessions, a 7-day lifetime, HTTPOnly and SameSite cookie flags, and HTTPS-only enforcement in production. The SECRET_KEY is loaded from an environment variable. If it is missing in production, the application raises an exception immediately rather than falling back to an insecure default.
Step 4: Rate Limit Configuration from DynamoDB
Rate limits are not hardcoded in the application. They are loaded from a DynamoDB table at startup:
rate_limits_config = load_rate_limits()This means rate limits can be changed tightened during an attack, relaxed for a promotion without redeploying the application. The new limits take effect the next time the server restarts. Each endpoint can have its own limit defined by the number of requests and the time window in seconds.
Step 5: Application Version from DynamoDB
The application version is fetched from DynamoDB and injected into every rendered HTML template via a context processor:
@app.context_processor
def inject_template_globals():
    return {
        'app_version': load_app_version(),
        'is_admin': is_admin_user()
    }
This means the version number displayed in the UI is always the value stored in DynamoDB, not anything compiled into the code. Updating the displayed version is a single DynamoDB write, no deployment required.
Step 6: Background Monitoring Threads
The final step of startup is launching two background threads that run for the lifetime of the server process:
System Health Monitor collects CPU usage, memory usage, disk usage, and network I/O every five minutes using the psutil library and writes each snapshot to DynamoDB. This provides a historical record of server health that is visible in the admin panel.
Alert Manager runs a separate check every 60 seconds. If any metric exceeds its configured threshold for example, memory usage crossing a critical percentage it sends an email alert via AWS SES. Alert state is tracked in DynamoDB so the same condition does not trigger repeated emails; each alert type has a cooldown period before it will fire again.
Both threads are daemon threads, which means they are automatically stopped when the main process exits. They produce no output under normal conditions only when something is wrong.
The Full Startup Timeline
From the moment the process starts to the moment it accepts the first request:
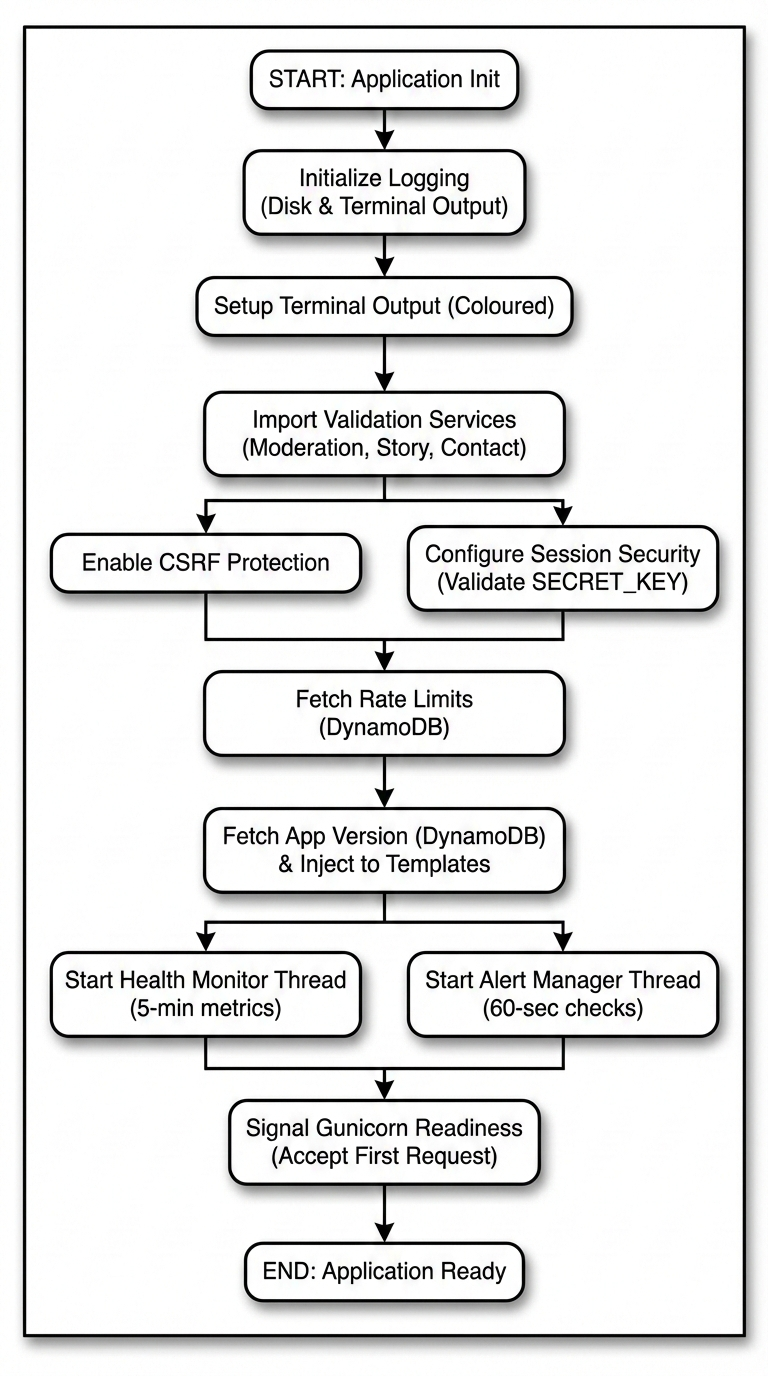
The entire sequence completes in a few seconds. Most of that time is the DynamoDB round-trips.
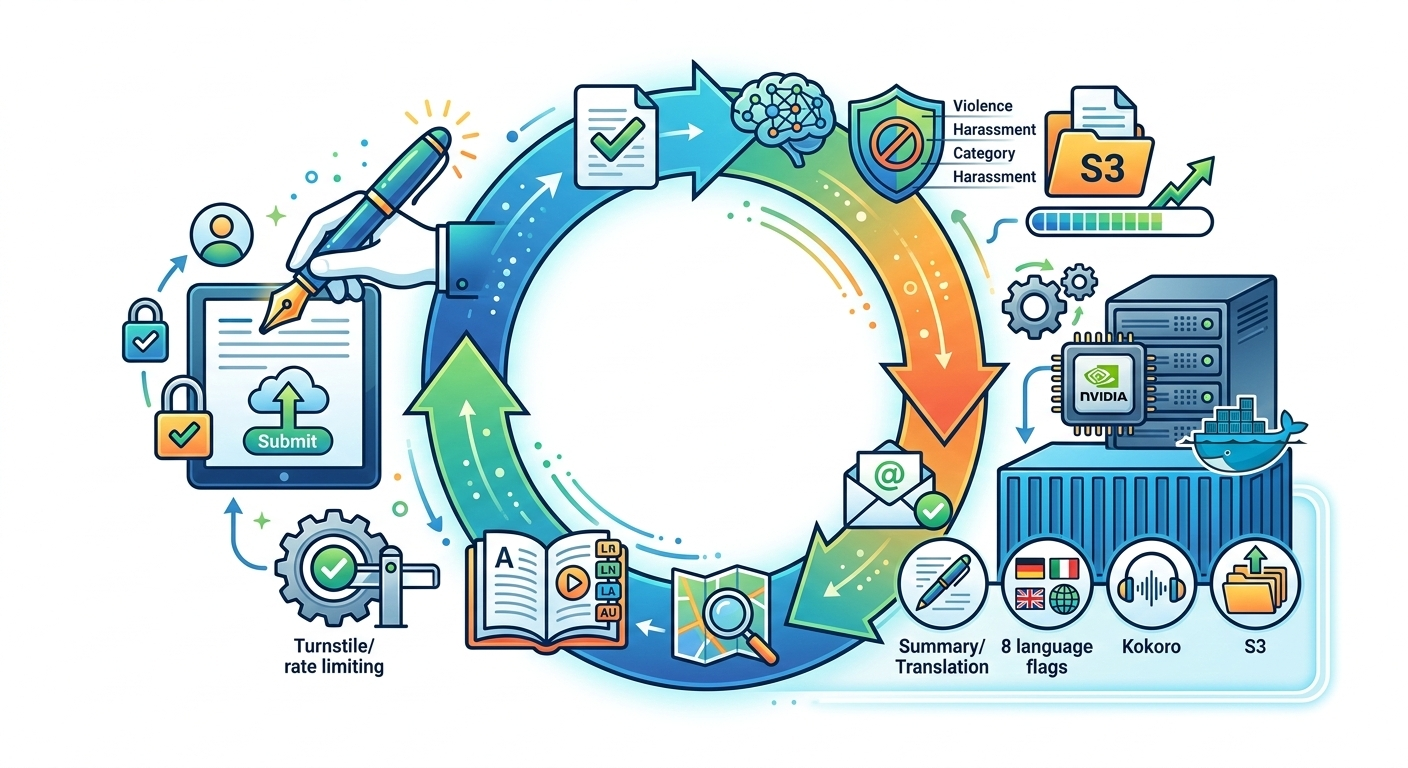
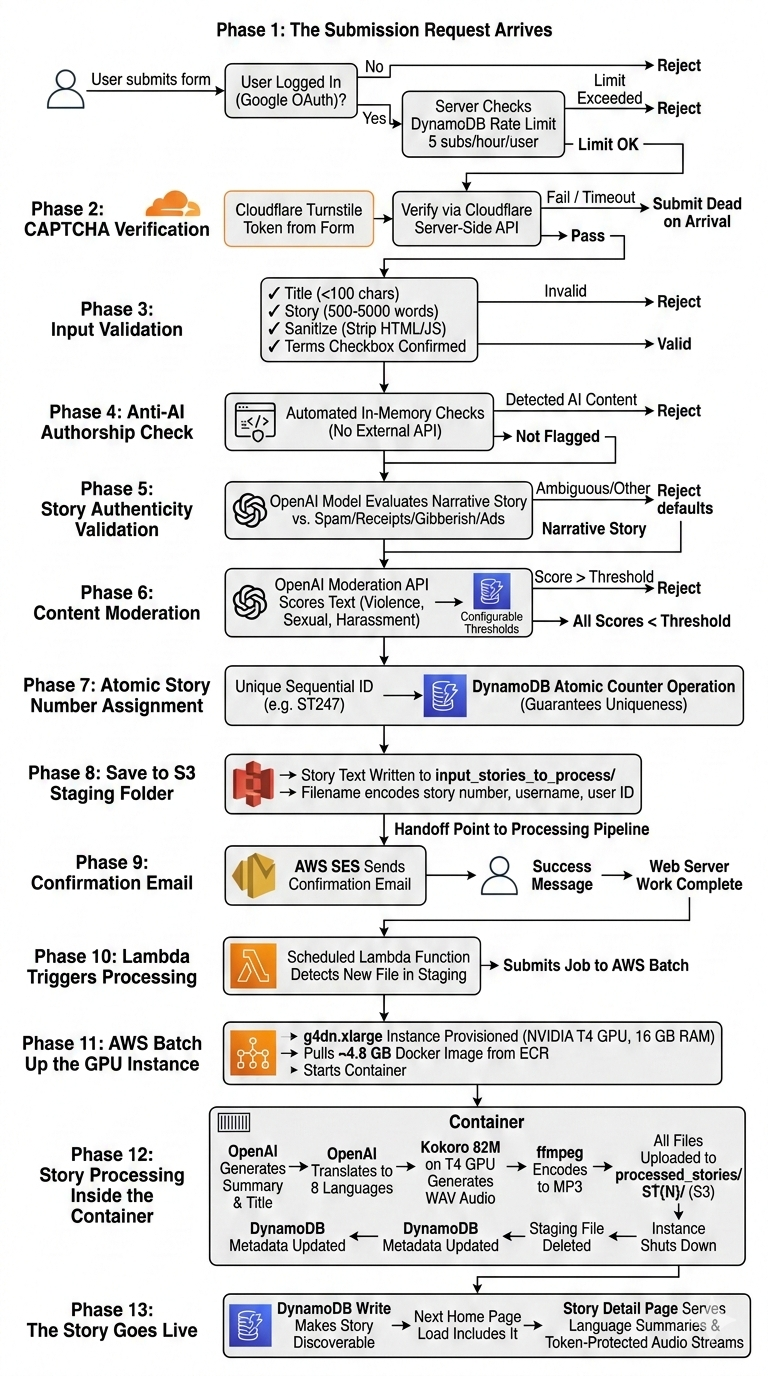
The Full Story Lifecycle
When a user clicks “Submit” on MicroTales, they get a success message and are told their story will be processed soon. What actually happens between that button press and the moment their story appears on the site as a fully narrated, multi-language audio experience is anything but simple. This post walks through the entire lifecycle in detail, from the first HTTP request all the way to the story becoming discoverable and playable by every visitor on the platform.
There are two completely separate compute systems involved. The first is the always-on web server running the Flask application, which handles everything up to saving the raw story text to S3. The second is an on-demand GPU instance that wakes up specifically to process stories and then goes back to sleep. Understanding that boundary is key to understanding the whole pipeline.
Phase 1: The Submission Request Arrives
The story submission endpoint requires authentication. If a user tries to access it without being logged in, they are redirected to the Google OAuth flow immediately. There are no local passwords on MicroTales at all. Every user identity is a Google account, and the server stores a Google-issued unique identifier in the session alongside their name, email, and profile photo.
Once the user is authenticated and submits the form, the very first check before anything else runs is a DynamoDB-backed rate limit. Each authenticated user is allowed a maximum of 5 story submissions per hour. The rate limit counter is stored in DynamoDB and shared across all Gunicorn worker processes simultaneously, so it cannot be bypassed by getting lucky and hitting a worker with a fresh in-memory counter. Exceeding the limit returns HTTP 429 immediately without executing any further logic.
Phase 2: CAPTCHA Verification
If the rate limit passes, the first thing the server processes from the submitted form data is the Cloudflare Turnstile CAPTCHA token. MicroTales uses Turnstile rather than traditional CAPTCHA systems because it runs its challenge invisibly in most cases, without forcing users to click traffic lights.
The Turnstile secret key is not stored in any config file or environment variable on disk. It lives encrypted in DynamoDB using AES-256-GCM, with the decryption key derived from a secret that only exists on the EC2 instance. Once fetched, the key is cached in memory for the lifetime of the process so that DynamoDB is not hit on every submission.
With the secret key in hand, the server makes a POST request to Cloudflare’s server-side verification endpoint. Cloudflare returns a JSON response indicating whether the token is valid. If the verification fails for any reason, including a network timeout capped at 10 seconds, the submission is rejected outright and the user is returned to the form with an error. The server never proceeds past this point with an unverified CAPTCHA.
Phase 3: Input Validation
With the CAPTCHA cleared, the server runs basic structural validation on the submission fields:
- The title must be present and cannot exceed 100 characters.
- The story text must be present, at least 500 words long, and no more than 5000 words.
- Both fields are sanitized to strip any HTML tags or JavaScript before any further processing occurs.
- The Terms and Conditions checkbox must be checked.
These checks happen in order and the first failure short-circuits the rest. The word count limits exist to prevent both empty submissions and extremely long texts that would push processing times into territory the system was not designed for.
Phase 4: The Anti-AI Authorship Check
Before calling any AI service, the server runs automated checks specifically designed to detect AI-generated content. If a submission is flagged, it is rejected immediately and the user receives a message explaining that only original, human-written stories are accepted. These checks run entirely in memory before any external API calls are made, which keeps them cheap and fast regardless of how many submissions are attempted.
Phase 5: Story Authenticity Validation
The next stage uses an OpenAI model to determine whether the submission is actually a story at all versus some other type of text. This catches a specific class of bad submissions that content moderation alone would miss: pasted receipts, product listings, random gibberish, copy-pasted advertisement copy, or form submissions from people who clearly did not read what the page was asking for.
The title and story text are sent together to the model with a prompt asking whether the submission is a genuine narrative, fiction or non-fiction, versus any of those other categories. The response is parsed for a YES or NO answer, and if neither appears explicitly, the parser looks for indicator words in the model’s response to make the determination.
If the response is ambiguous and no clear indicators are found, the system errs on the side of rejection. The reasoning is that a genuine story will almost always produce clear signals in the model’s response, and an ambiguous result is more likely to indicate a problematic submission than an edge case of legitimate fiction.
All API keys used at this stage are loaded from the same encrypted DynamoDB store and cached in memory within the Gunicorn worker process so the DynamoDB table is not hit on every request.
Phase 6: Content Moderation via OpenAI Moderation API
Assuming the story passes the authenticity check, it enters the content moderation stage. The server calls the OpenAI Moderation API, a purpose-built endpoint designed specifically for screening text for harmful categories.
The story title and text are combined into a single string and sent to the Moderation API, which returns a score from 0.0 to 1.0 for each of several content categories: adult/sexual content, graphic violence, harassment, self-harm, and others.
The thresholds for each category are not hardcoded. They are stored in a DynamoDB table, one record per category, each with a configurable threshold value. This design means the moderation sensitivity can be tuned at any time by updating a DynamoDB record, with no code change or deployment required. Tightening thresholds during a period of abuse is a single write operation.
The server compares each category score against its configured threshold. Any category that exceeds its threshold is recorded as a violation. If there are any violations, the submission is rejected and the user receives a message identifying which content policy areas were flagged.
If the OpenAI Moderation API itself returns an error, the submission is rejected as a fail-safe. The system is intentionally designed so that a failure in the moderation layer blocks the submission rather than allowing it through unchecked.
Phase 7: Atomic Story Number Assignment
At this point, every validation gate has been passed. The story has cleared the anti-AI checks, been confirmed as a genuine narrative, and its content is within policy. Now the server needs to assign it a permanent identifier before saving it.
Every story on MicroTales gets a sequential identifier in the format ST{number}. The number must be unique and must never be duplicated, even if two users submit stories simultaneously across different Gunicorn workers.
This is handled using a DynamoDB atomic counter. The server calls an update_item() operation on a dedicated counter table using DynamoDB’s ADD expression, which is atomic at the DynamoDB level. Two concurrent requests cannot get the same number because DynamoDB processes the increment atomically. Each worker gets a unique number, regardless of timing.
The fallback chain for edge cases goes through three levels:
- If the atomic counter table has an entry for the story counter, increment it and use the result.
- If the table exists but has no counter record yet, scan the story metadata DynamoDB table to find the highest story number already in use and initialize the counter from there.
- If that scan also fails, scan the
processed_stories/folder in S3 for the highestST{N}folder name present.
In practice under normal operation, only step 1 ever runs. The fallback chain exists to handle first-run initialization and disaster recovery scenarios.
Phase 8: Save to S3 Staging Folder
With a unique story number assigned, the story text is saved to S3. The content written is the title and text combined. The S3 key uses a specific naming format:
input_storied_to_process/ST{number}-{username}-{user_id}.txtFor example: input_storied_to_process/ST247-jane_doe-google-sub-98765.txt
The folder input_storied_to_process/ acts as a staging queue. It is entirely separate from processed_stories/, where finished stories live. Dropping the file into this folder is the handoff point between the web server and the processing pipeline. The web server’s job is now done.
Before writing, the server checks that the file does not already exist at that key. If it does, which should not happen with the atomic counter in place but is handled defensively, the server attempts to get a new story number and retries the save once before giving up.
Phase 9: Confirmation Email via AWS SES
After a successful S3 write, the server sends a confirmation email to the submitting user via AWS SES. The email contains the story title and submission details. This is a best-effort operation and does not block the submission success response if the email send fails, though a failed send is logged as a warning.
The user is then shown a success flash message and redirected back to the submission page.
At this point, from the user’s perspective, the submission is complete. From the system’s perspective, the story is sitting as a plain text file in an S3 staging folder, waiting for the second half of the pipeline to pick it up.
Phase 10: Lambda Triggers Processing
A Lambda function runs on a schedule and monitors the S3 staging prefix for pending files. When it detects one or more files waiting, it submits a job to AWS Batch. This is what bridges the stateless web server and the GPU processing environment.
The Lambda is lightweight by design. Its only job is to notice that work exists and kick off the Batch job. All actual processing happens inside the containerized Batch job itself.
There is also a separate Lambda function dedicated to site health monitoring. That function runs independently, checks whether the MicroTales website is reachable via HTTP, and if it finds the site is down, it initiates an automated EC2 stop-and-start cycle to recover the instance. This is completely separate from the story processing pipeline.
Phase 11: AWS Batch Spins Up the GPU Instance
The AWS Batch compute environment is configured to scale to zero when idle. There is no GPU instance running when no stories are being processed. When the Lambda submits a Batch job, AWS spins up a g4dn.xlarge instance on demand.
The g4dn.xlarge has 4 vCPUs, 16 GB of RAM, and an NVIDIA T4 GPU. The T4 is specifically required for running the text-to-speech model at practical speeds. Without GPU acceleration, audio generation for a full-length story across multiple languages would take far longer than is practical.
Once the instance is running, AWS Batch pulls the processing Docker image from ECR (approximately 4.8 GB) and starts the container. The container is allocated 4 vCPUs, 14 GB RAM, and the full GPU.
Phase 12: Story Processing Inside the Container
This is where the raw text file transforms into a finished multi-language audio story. The container runs a processing pipeline with several sequential stages for each pending story found in the staging folder.
- Stage 1: Summarization and Title Extraction
The story text is sent to the OpenAI API, which generates a polished summary and a clean title. This is separate from the user-submitted title and exists to give the story a well-formatted presentation across all supported languages. - Stage 2: Translation into All Supported Languages
The story text, title, and summary are all translated into every supported language: English, Spanish, French, Hindi, Italian, Portuguese, Mandarin Chinese, and Japanese. This is also handled via the OpenAI API. The translations produce eight complete versions of the story content, one per language. - Stage 3: Text-to-Speech Audio Generation
This is the most compute-intensive step and the reason the T4 GPU exists. Audio is generated for each language version using Kokoro 82M, a locally-running open-source TTS model. Kokoro runs entirely within the Docker container. There is no cloud TTS API call here, which keeps per-story processing costs very low compared to using a managed speech service.
The T4 GPU runs the TTS model inference. Each language produces one or more WAV audio files containing the narrated story. - Stage 4: Audio Encoding
The raw WAV files from the TTS model are converted to MP3 at 192 kbps using ffmpeg, which is bundled inside the Docker image. MP3 reduces file sizes significantly compared to WAV, which matters both for storage costs and for audio streaming latency when users hit play. - Stage 5: Upload to S3 and Metadata Write
All generated files are uploaded to S3 underprocessed_stories/ST{N}/. The folder structure for a finished story looks like this:
processed_stories/ST247/
  index.json
  full_text.txt
  summary_a.txt       (English summary)
  summary_e.txt       (Spanish summary)
  summary_f.txt       (French summary)
  summary_h.txt       (Hindi summary)
  summary_i.txt       (Italian summary)
  ST247_audio_1.mp3
  ST247_audio_2.mp3   (second narration voice or language, if generated)
The index.json file stores structured metadata for the story: the story number, title, submitting username, user ID, creation date, the list of audio file names, and vote counters.
After the S3 upload, the story metadata DynamoDB table is updated, making the story discoverable via the web application. This DynamoDB write is what officially makes the story live.
The original staging file is deleted after successful processing. Job logs are written to S3 rather than CloudWatch to avoid unnecessary logging costs.
- Stage 6: Instance Shutdown
Once the Batch job completes, theg4dn.xlargeinstance is terminated. The compute environment scales back to zero. No GPU compute is running or accruing cost until the next story is submitted.
Phase 13: The Story Goes Live
From the moment the DynamoDB metadata write completes, the story is live. The next time any user loads the MicroTales home page, the application queries the story metadata table to build the story list, and the new story will appear in that list.
On the story detail page, the server fetches the summary from S3 in the visitor’s preferred UI language. If the user has their UI set to Spanish, the Spanish summary file is retrieved. If that specific language file has not been generated yet, the server falls back to any available language file automatically. The full story text is served from S3, and the audio file list is built by listing all MP3 objects in the story’s S3 folder.
Audio files are never served from a public URL. When the story page renders, the server generates a short-lived token for each audio file using a SHA-256 hash of the story name, file name, session ID, and a timestamp. These tokens expire five minutes after the page loads. When the user presses play, the audio request is validated against the token stored in their session, and the file is streamed from S3 only if the token is valid and unexpired. A background token refresh mechanism extends playback sessions so that long audio files do not cut out mid-playback due to token expiry.
The Full Picture
The complete lifecycle spans two AWS instances and several independent services, but from the user’s perspective it looks like a simple form submission followed by a waiting period. The submission side runs in milliseconds to a few seconds, gated by the anti-AI checks and two sequential AI API calls for story authenticity and content moderation. The processing side runs for several minutes on a GPU instance that exists only for that job and is then gone.
A simple summary of what each system owns:
Web server (always-on t2.micro):
- Authentication and session management
- CAPTCHA verification
- Input validation and sanitization
- Anti-AI authorship checks
- Story authenticity validation
- Content moderation
- Atomic story number assignment
- S3 staging upload
- Confirmation email
Processing pipeline (on-demand g4dn.xlarge):
- Story summarization via OpenAI
- Translation into 8 languages via OpenAI
- Text-to-speech audio generation via Kokoro 82M on GPU
- Audio encoding to MP3 via ffmpeg
- S3 upload of finished assets
- DynamoDB metadata write to make the story live
- Cleanup of the staging input file
The separation is intentional. Keeping the GPU work off the web server means the always-on instance stays cheap and predictable. Keeping the submission validation on the web server means stories are screened before they ever enter the processing queue, so the GPU compute is only spent on content that has already cleared all quality and moderation gates.

Logging
MicroTales has a layered logging system that handles everything from individual HTTP requests to long-term visitor analytics. It is not a single logger pointed at a file. It is a pipeline: logs are written to disk, periodically archived to S3, then processed hourly by two separate analytics pipelines that push structured data into DynamoDB. A parallel system monitors server health independently. All of this runs continuously in the background while the application serves requests.
How Logs Are Written
- The TeeOutput Class
Everything starts inapp.py. Before the Flask application does anything, bothsys.stdoutandsys.stderrare replaced with a custom class calledTeeOutput. This class wraps the original stream and an open file handle tofrontend/app.log. Everyprint()call and every raised exception or traceback that goes to stderr gets written to both the terminal and the log file simultaneously. The file is opened in append mode with UTF-8 encoding.
On startup, the existingapp.logis deleted and a fresh one is created. Every deployment therefore starts with a clean log file. - The Log Format
The primary logging function throughout the application islog_user_action()inutils.py. Every significant event in the application goes through this function. The output format is:
[YYYY-MM-DD HH:MM:SS.mmm] EMOJI ACTION_TYPE | USER:user_id | IP:client_ip | UA:first_50_chars_of_user_agent | detailsThe timestamp includes milliseconds. The user ID comes from the active session if one exists, or falls back to
ANONYMOUSorNO_SESSION_CONTEXT. The client IP is extracted from theX-Forwarded-Forheader first (taking the first IP if the header contains a comma-separated chain), thenX-Real-IP, thenrequest.remote_addr. The user agent is truncated to 50 characters in the log line. - Colored Output
The console output is color-coded using ANSI escape sequences. TheColorsclass inutils.pydefines over 30 text colors and background colors along with style modifiers like bold, dim, italic, and underline. Each action type maps to a color. Authentication events print in lime green. Database operations print in teal. S3 operations print in orange. Audio streaming events print in cyan. Voting and favorites print in pink. Performance metrics print in gold. Errors print in bright red with a red background for critical ones.
The color selection uses a four-level priority system. First it looks for an exact match in theACTION_TYPE_COLORSdictionary. If there is no exact match it looks for wildcard prefix patterns such asAUTH_orDB_. If that fails it applies regex matching against common prefixes. If nothing matches it falls back to the color for the log level itself.
Each action type also gets an emoji prefix chosen through similar priority logic. Success events get a checkmark. Auth operations get a key or lock. Database reads get a magnifying glass and writes get a notepad. S3 uploads get an outbox arrow and downloads get an inbox arrow. Audio operations get a musical note. Performance measurements get a chart.
The Python standard logging module is also configured to use this same color system. TheColoredLogFormatterclass intercepts calls tologger.info(),logger.error(), and so on from any module. If the message already contains ANSI codes it passes it through unchanged. Otherwise it infers an action type from the logger name and message content, then applies the same color and emoji logic.
- Log Level Control
The root logging level is controlled by theMICROTALES_LOG_LEVELenvironment variable, defaulting toINFO. SettingMICROTALES_CLEAN_LOGS=1makeslog_user_action()additionally emit a clean non-colored version of every log line through the Python logging module, which is useful for log parsing tools that do not handle ANSI codes.
What Gets Logged
- Every HTTP Request
Two Flask hooks log every request the application handles.
Thebefore_requesthook fires before any route handler runs and writes aREQUEST_STARTlog entry. For every request this includes the HTTP method, path, and query string. For authenticated users it additionally logs the user ID, email address, current UI language, dark mode preference, and audio session ID. For paths under/auth/it logs extra detail about the OAuth flow state.
Theafter_requesthook fires after the route handler returns a response and writes aREQUEST_ENDlog entry. It calculates the duration of the request in milliseconds using a start time that was set duringbefore_request. It logs the HTTP status code and sets the log level based on the response: 4xx responses log at WARNING, 5xx responses log at ERROR, everything else at INFO. After writing this log entry the hook callsstore_visitor_analytics()to record the request in DynamoDB in real time.
- Application Events
The application logs over 200 distinct action types. A few categories to illustrate the depth: Authentication flows log every step: when the OAuth redirect is initiated, when the callback arrives, when the token exchange happens, when the token is decoded, when user info is fetched, when a session is created, and when a user logs out.
Story submission logs every stage of the multi-step validation pipeline: the Cloudflare Turnstile CAPTCHA verification, language validation, OpenAI content moderation, story authenticity validation, the actual file storage to S3, and the confirmation email send.
Audio streaming logs every access attempt including token validation, referrer checks, file type validation, and whether the stream was authorized or blocked.
Admin actions are logged through a separatelog_admin_action()function inadmin_utils.py, which wrapslog_user_action()with a default user ID ofSYSTEMwhen no session context is available. Every admin panel page view and every admin API call is logged with its own action type.
Performance timing is logged throughlog_performance(), which calculates request or operation duration and color-codes the output: under 100ms prints in gold and appendsFAST, 100 to 500ms is normal, 500 to 2000ms prints in coral and appendsSLOW, and over 2000ms prints in amber at WARNING level and appendsVERY_SLOW.
- Client-Side Events
Because the application blocks browser console output for security reasons, it provides two HTTP endpoints for JavaScript to report events back to the server log.
POST /api/debug-logaccepts a JSON body with aneventfield and logs it asCLIENT_DEBUG_{event}.
POST /log_client_erroraccepts a JSON body withlevel,message,details, andurlfields and logs it asCLIENT_{level}This is how JavaScript errors reach the server logs.
Getting Logs Into S3
The local app.log file is uploaded to S3 every five minutes by a shell script called upload_logs.sh, designed to run as a cron job.
The script uses a lock file at /tmp/upload_logs.lock to prevent concurrent runs. If a stale lock exists (older than five minutes) it removes it and continues. The script skips the upload if the log file does not exist, is smaller than 100 bytes, or contains only a previous “Log cleared” marker with fewer than four lines.
When the conditions are met the script runs a short Python snippet using boto3 to upload the current contents of app.log to the S3 bucket audiogenbucket-474892882673 under the key logs/app_YYYYMMDD_HHMMSS.log where the timestamp reflects the moment of upload. The file is uploaded as text/plain.
After a successful upload the script truncates app.log to a single marker line indicating which S3 key the log was uploaded to, followed by a separator. The application continues writing new log entries from this point forward until the next upload cycle.
This means that at any point in time, recent logs are split between the live app.log on the EC2 instance and a series of timestamped snapshots in the logs/ prefix of the S3 bucket.
Visitor Analytics Pipeline
- Real-Time Storage
Every time a request completes, theafter_requesthook callsstore_visitor_analytics(). This function writes to a DynamoDB table calledvisitor_analyticsimmediately, without waiting for any batch job. The table uses a composite key of(date, hour), so there is one record per hour per day. Each write updates running totals for that hour: total request count, set of unique IP addresses, set of unique user IDs, top pages by path, top IPs by request count, browser distribution, and HTTP status code counts. Each IP also has a session tracked with a first-seen and last-seen timestamp and a request count. Records carry a 30-day TTL and expire automatically.
This is the primary source of the analytics dashboard data. The S3-based processing pipeline described below was the original design and now serves as a secondary and historical path. - Hourly Batch Processing from S3
TheLogAnalyticsProcessorclass inlog_analytics.pyruns as a background thread that processes log files from S3 once per hour. It reads files from thelogs/prefix, strips ANSI color codes from each line, and parses them against a regex that extracts the timestamp, action type, user ID, client IP, user agent, and the details field.
It only countsREQUEST_STARTentries toward visit metrics. The parsed entries are aggregated into hourly buckets with the same metrics tracked in real time: unique IPs and users, top pages, browser breakdown (Chrome, Firefox, Safari, Edge, Other), and status code groupings (2xx, 3xx, 4xx, 5xx) as well as individual status codes.
For each IP address in the top 20 for a given hour, the processor calls the ip-api.com free geolocation API to resolve country, city, and country code. A local in-memory cache keyed on IP address prevents repeated lookups. The API rate limit of 45 requests per minute is respected with a 50ms sleep between requests.
The aggregated hourly data is saved to the samevisitor_analyticsDynamoDB table.
The processor also saves permanent detailed visitor logs to S3 under the pathanalytics/visitor_logs/YYYY/MM/DD/visitor_log_YYYYMMDD_HH.json. Each record contains the timestamp, IP address, user ID, user agent, request path, and HTTP status code for a single request.
An idempotency check prevents reprocessing hours that have already been stored. If an hour is processed and no data is found, an empty marker record is saved to prevent the hour from being reprocessed on subsequent runs.
Server Health Monitoring
The SystemHealthMonitor class in system_monitor.py runs as a background daemon thread that collects system metrics every 300 seconds (five minutes) and writes them to DynamoDB.
Each collection snapshot includes CPU percentage, memory percentage along with used, total, and available values in megabytes, disk percentage along with used, free, and total values in gigabytes, total cumulative network bytes sent and received, bytes-per-second send and receive rates calculated from the change since the previous collection, the number of active network connections from psutil.net_connections(), and the total process count from psutil.pids().
All numeric values are stored as Decimal types for DynamoDB compatibility. Each record carries a 5-day TTL after which DynamoDB automatically removes it. The table is server_health_metrics with (timestamp, server_id) as the composite key, where the server ID comes from socket.gethostname().
The current metrics are also available on demand through get_current_metrics(), which returns float values rather than Decimals for JSON serialization. Historical metrics for any time range up to 24 hours back can be queried through get_metrics_history().
Alert System
The MonitoringAlertManager class in monitoring_alerts.py runs a background checker thread that polls system metrics every 60 seconds.
Alert thresholds for CPU, memory, and disk usage are stored in a DynamoDB table called monitoring_alert_config. The defaults are 90% for all three. The destination email address, whether alerts are enabled at all, and the cooldown period between alerts are also stored there. The cooldown defaults to 60 minutes and prevents alert spam when a metric stays above threshold.
When a threshold is exceeded and the cooldown has elapsed, the alert manager sends an email through AWS SES. The email subject is System Alert: High Resource Usage on microtales.xyz and the body lists which metrics triggered, their current values, and the time of the alert.
Alert state is tracked in a second DynamoDB table called monitoring_alert_state keyed on alert type (cpu, memory, disk). After an email is sent the last-sent timestamp is written to this table. When a metric drops back below its threshold the state record is deleted, allowing a new alert to be sent if the metric rises again.
- DynamoDB Tables Used for Logging and Analytics
| Table | Key Structure | TTL | Purpose |
|---|---|---|---|
| visitor_analytics | date (HASH), hour (RANGE) | 30 days | Hourly visitor metrics and session data |
| error_analytics | date (HASH), hour (RANGE) | 30 days | Hourly error aggregates by signature |
| server_health_metrics | timestamp (HASH), server_id (RANGE) | 5 days | System health snapshots every 5 minutes |
| monitoring_alert_config | config_id (HASH) | none | Alert thresholds and email configuration |
| monitoring_alert_state | alert_type (HASH) | none | Cooldown tracking for active alerts |
- S3 Storage Layout for Logs and Analytics
| S3 Path | Content | Retention |
|---|---|---|
| logs/app_YYYYMMDD_HHMMSS.log | Raw application log snapshots uploaded every 5 minutes | Manual or lifecycle policy |
| analytics/visitor_logs/YYYY/MM/DD/visitor_log_YYYYMMDD_HH.json | Permanent per-request visitor records with geolocation | Permanent |
| analytics/error_logs/YYYY/MM/DD/error_log_YYYYMMDD_HH.json | Permanent per-error records with traceback and user context | Permanent |
Admin Panel Access
All of the data flowing through these pipelines is available through a set of protected admin routes. The analytics dashboard displays the aggregated visitor data from DynamoDB. The error logs dashboard shows error counts, top error signatures, and affected users. The health dashboard shows current and historical server metrics with time-series data. Alert configuration can be updated through the admin API without redeploying.
Admin access to these pages is itself logged. Each page view and each API call to the admin endpoints writes a log entry through log_admin_action(), creating an audit trail of who accessed what and when.
Below is a quick recording of me using the frontend while everything gets logged. Its rather interesting to see, well for now, mostly bots try and access the website and fails.

Admin Tools
On top of all this I also decided to build some additional administrative features into the app. All of these will only show up when I log in with my user account and will give me a nice big red “Admin” menu I can use to do and view things other users can not. I initially created this as I kept finding myself needing to log into the AWS console to view simple things like viewing s3 buckets or seeing if an entry has been added to the table in the database.
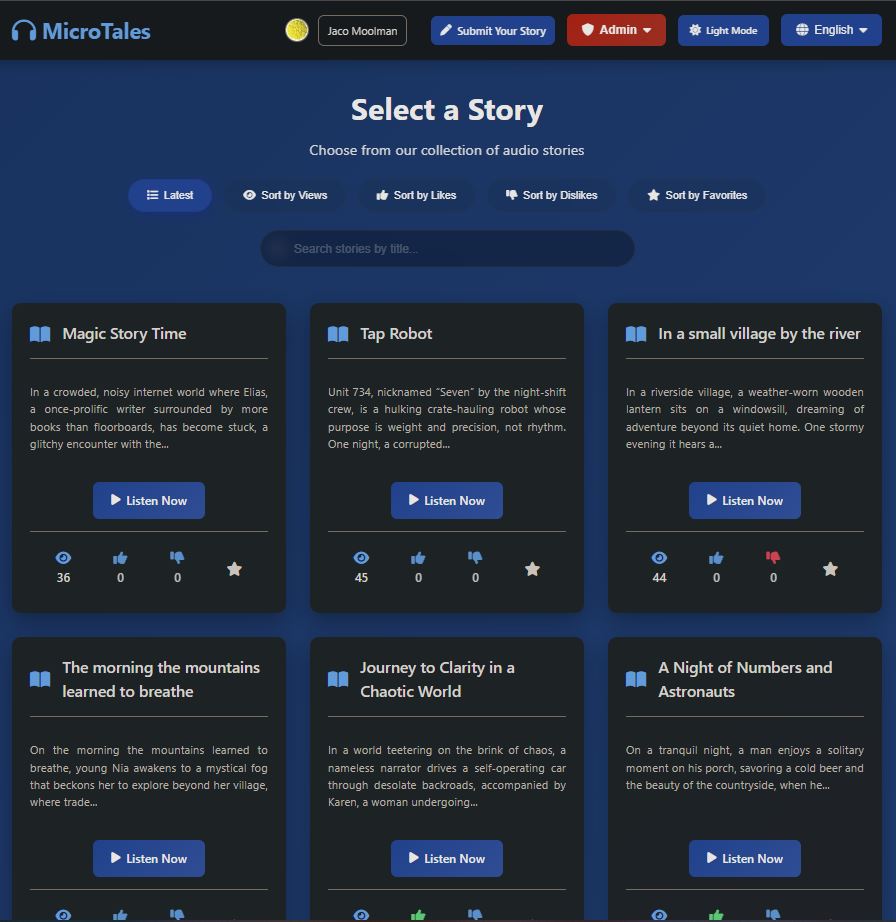
Among the many additional actions the admin user can I also made it so that the admin user can delete ANY story where as a normal user can only delete stories they themselves uploaded. Just incase something slips past the AI detector.
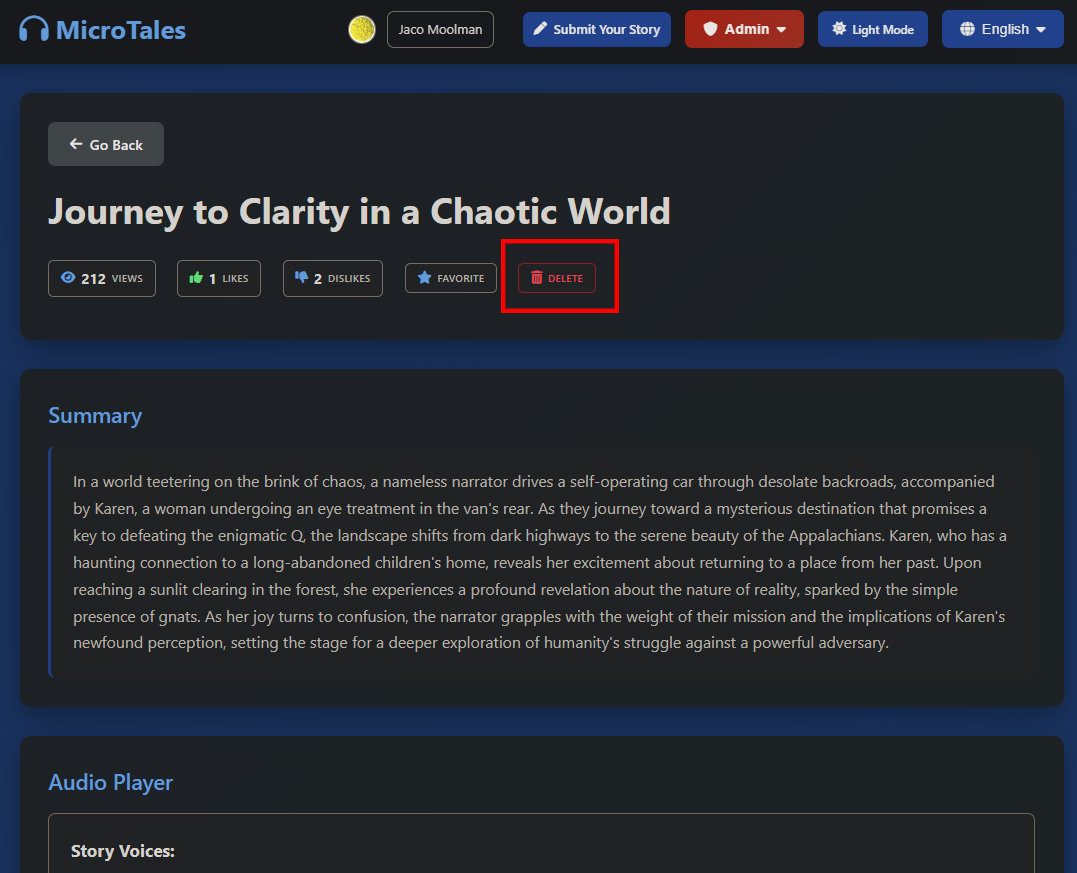
I wanted to see who connects to the website, how long they stayed and where they came from. I also wanted to see what was the main pages being looked at. And also have a view of registered users. This was very helpful in seeing how many bots and botnets tried to connect to my website. IP address lasting a couple of seconds usually meant a bot trying it’s luck with some known vulnerability like /wp-admin. While IP addressed with a stay time of say one to five minutes usually would mean an actual human is browsing the website listening to a story or two. All these records would be pulled from the raw logs, processed and then pushed to an DynamoDB table to I don’t have to process raw logs every single time I want to see visitor stats. This would run every 5min so I would always have a up to date view on who visited my site and for what reason.
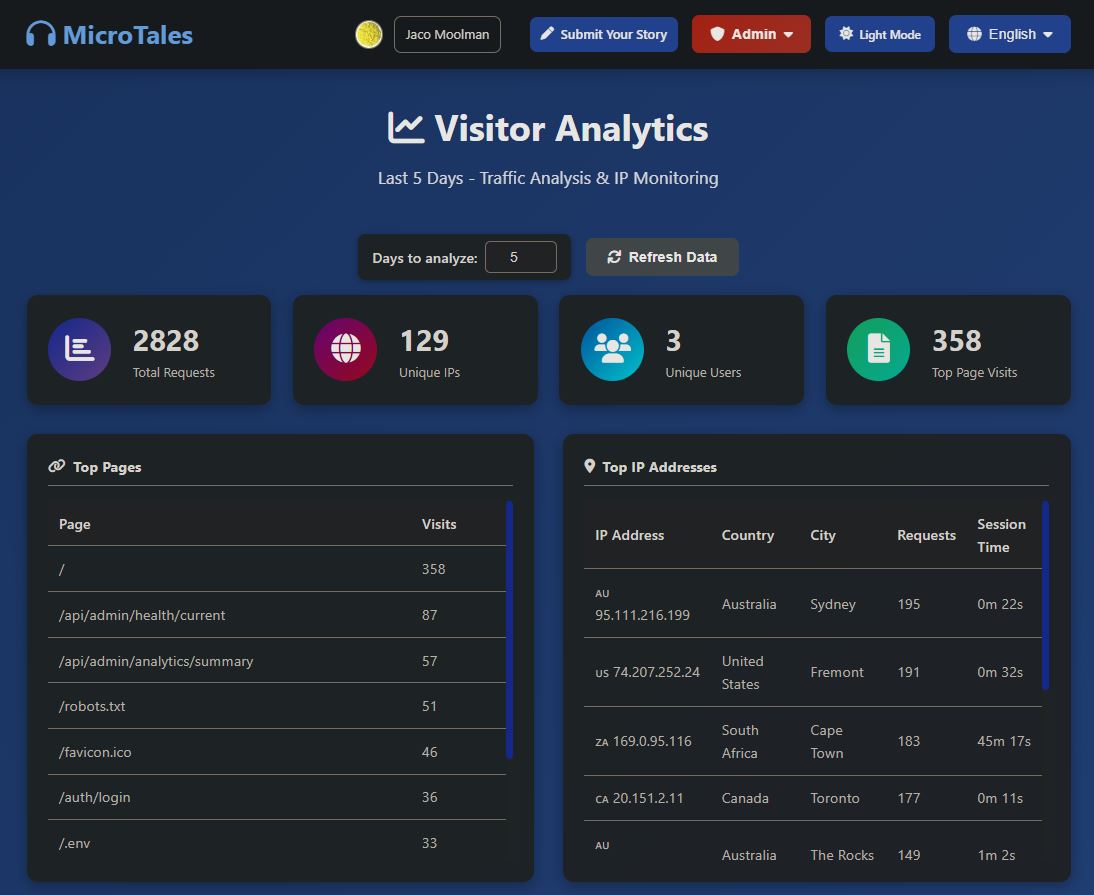
For IP geolocation, I uses the free ip-api.com service. When a visitor’s IP address is logged, the app makes a simple HTTP GET request to ip-api.com asking for the country, country code, and city fields. The response comes back as JSON, and if the lookup succeeds the result is stored in an in-memory cache so the same IP isn’t looked up twice. A small 50ms delay between requests keeps the app comfortably within
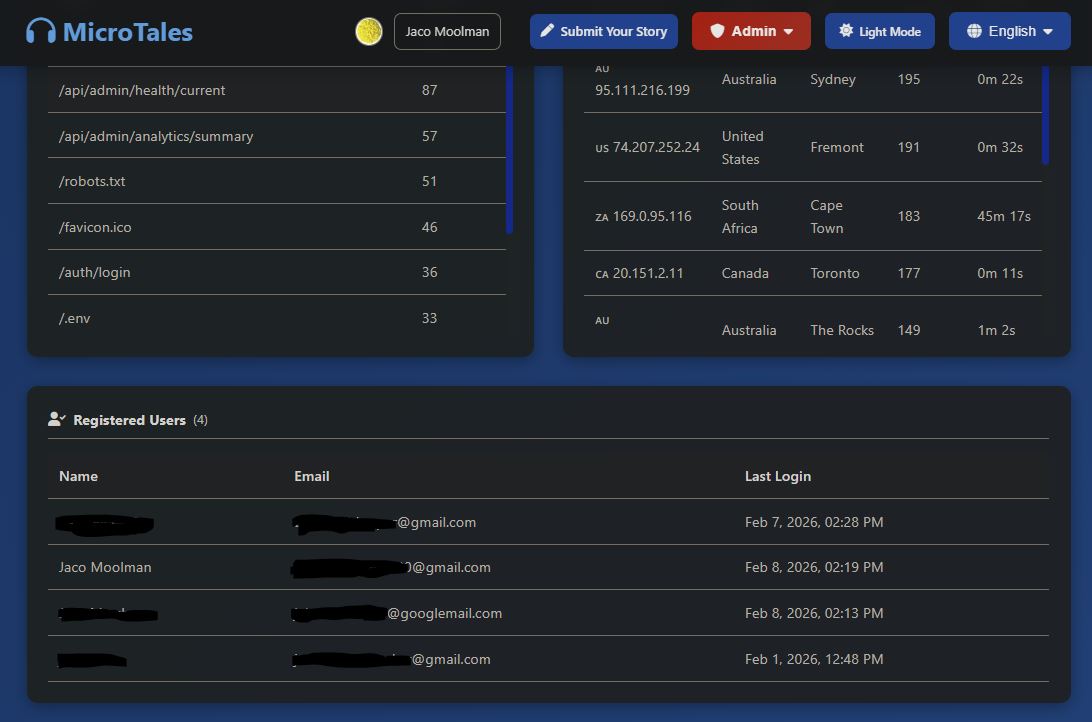
I also wanted to know in what state my EC2 server is in. So I created another admin page that displays all the stats of the server itself. From memory, CPU and disk usage. (Both space and IO) This would update every minute and keep the last 7 days worth of stats in a DynamoDB table so I can access it quickly when I need to. I also added a alerting system that will send me an email should any of the system metrics go above a set limit. In this case I’ve set all to 90%, but I can change each one individually. I also added a cooldown timer so that I wont get sent an email very minute if something is above the threshold. As with the contact form I use AWS SES as the backend where my email address is white listed. So far this has worked out rather well and have received the odd alert here and there mostly when I have a CPU spike.
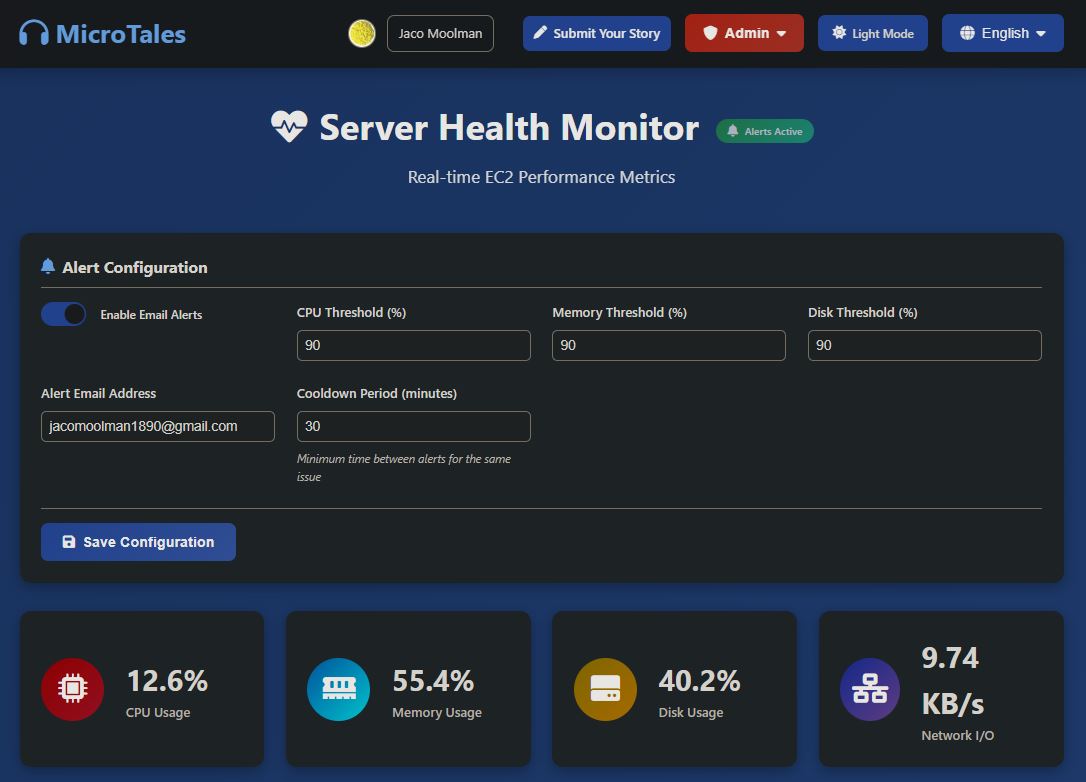
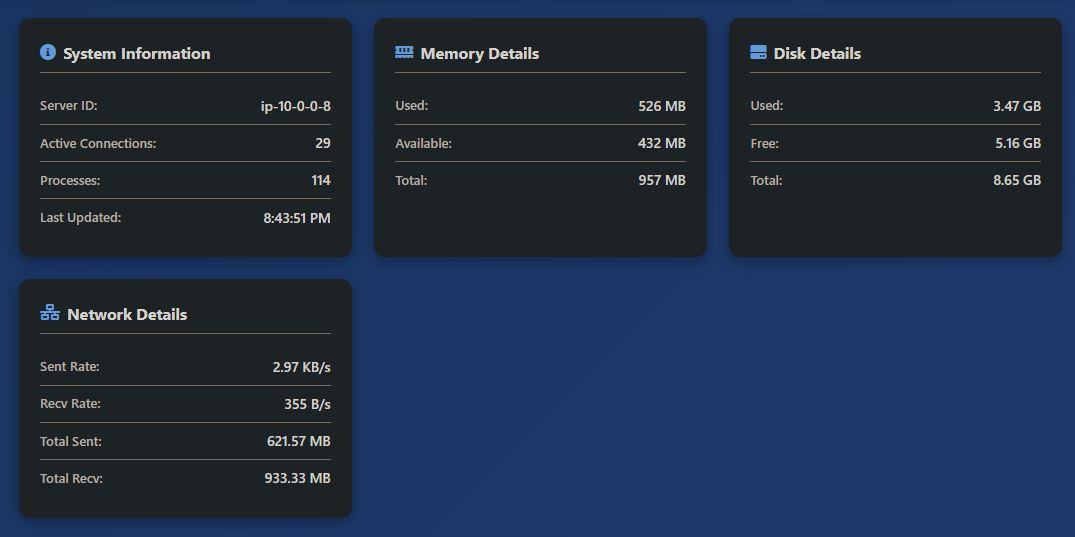
I also wanted to see a nice graph of the system metrics and have created this rather decent little dashboard showing the stats over time. This way I can quickly see if the alert I got once a once off or if I need to log in and see what or who is breaking things. And just like that I’ve created my own OPS dashboard I now am on standby for 24 7. The things you will do when going down a rabbit hole!
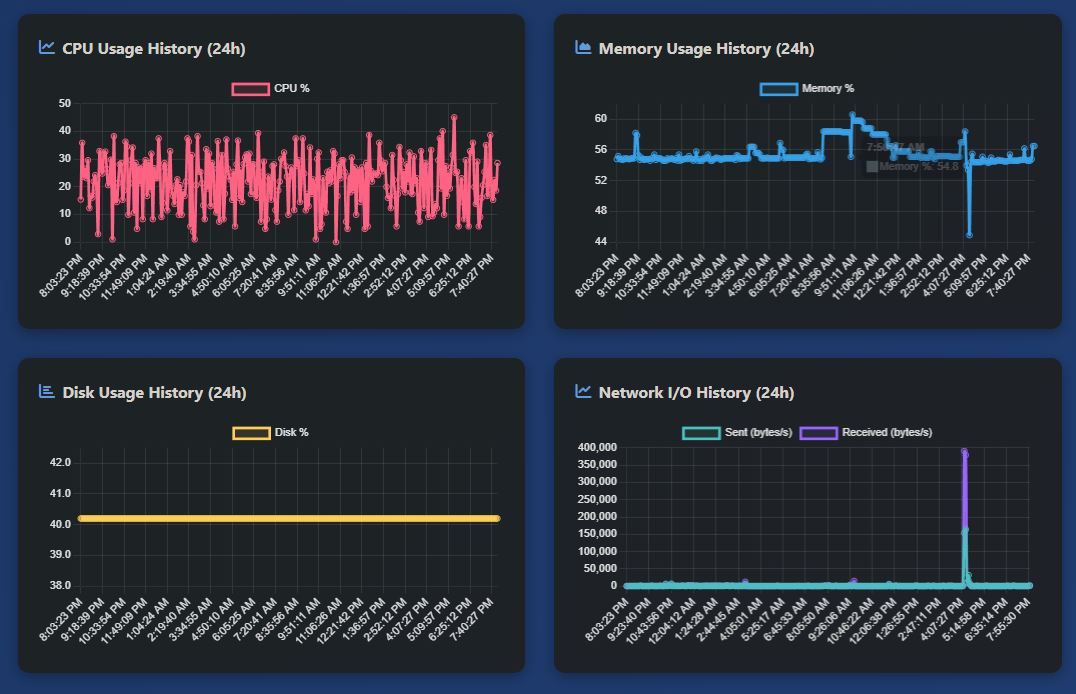
In addition to the system metrics I also graphed the website return codes like 3X’s 4X’s and 5X’s. It was interesting to see how many 400’s I got from all the bots trying all general pages that usually would be vulnerable to attack. Since I coded 99% of this side custom these pages don’t exist hence the 400 return codes (404 being the most common one)
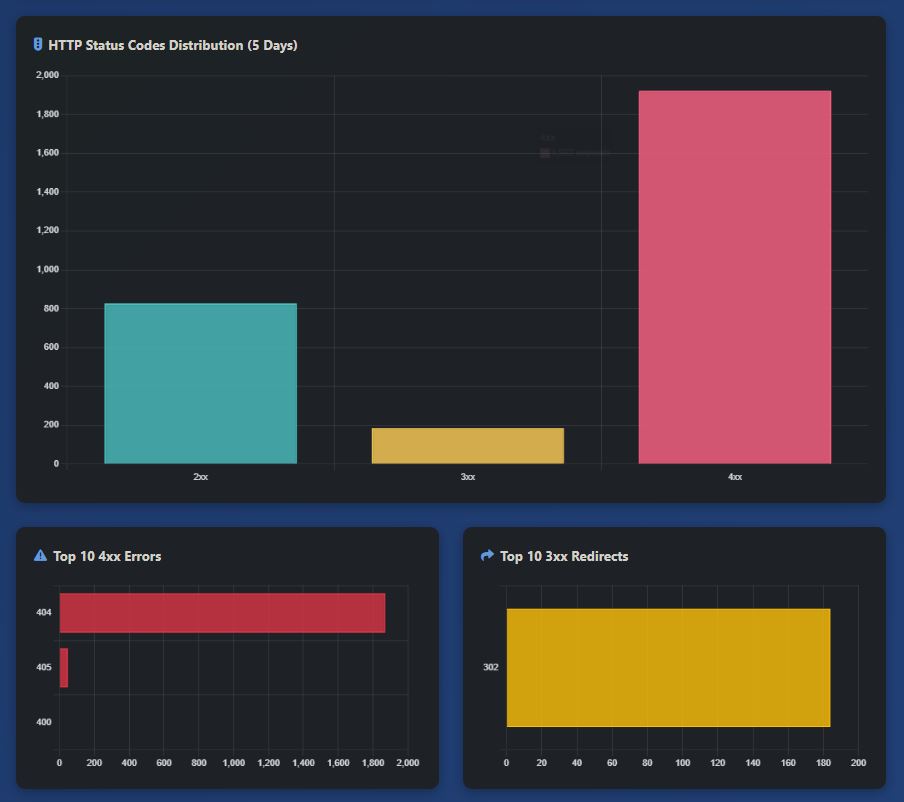
I also wanted to add a s3 file explorer so I could what what was happening in s3 without having to log into the AWS console every time. This allows me to delete, upload, rename and view files. I could have added more but this was all I needed.
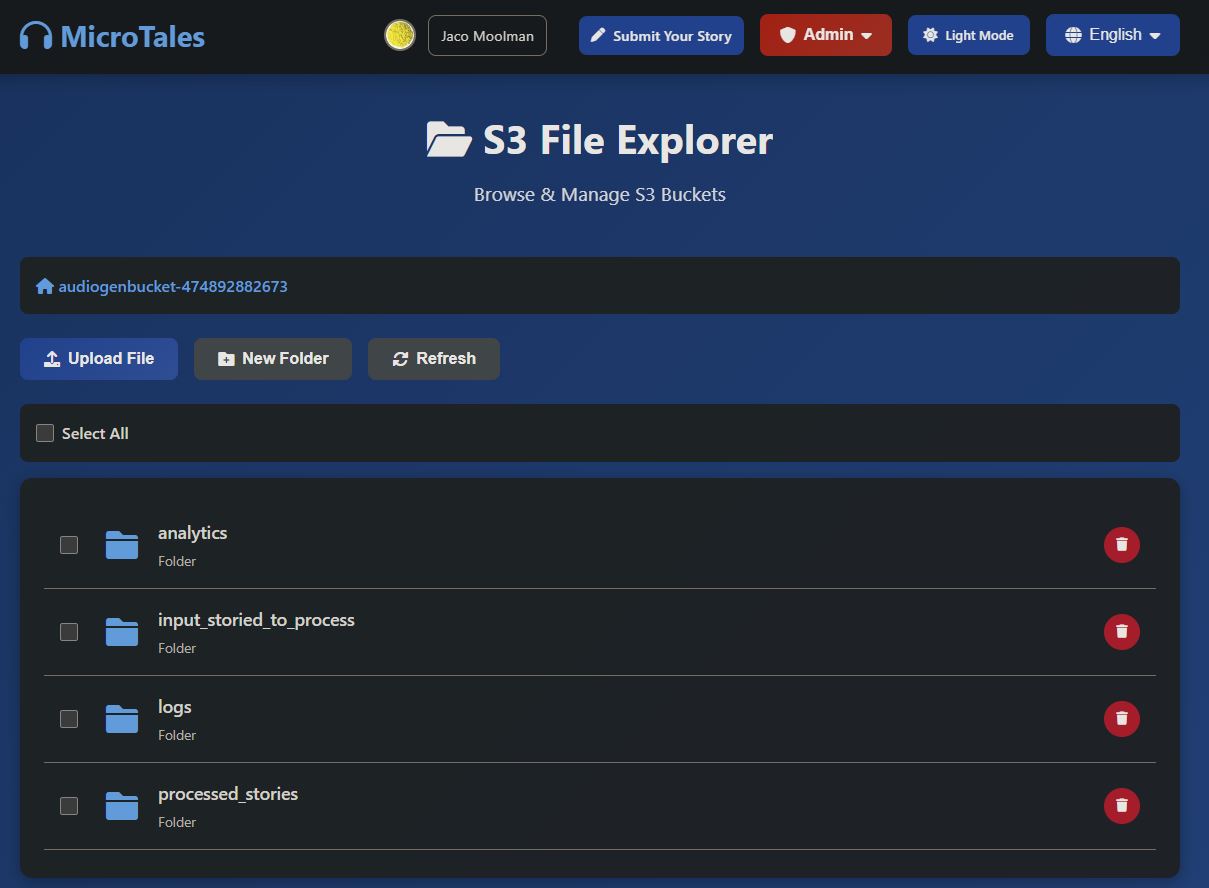
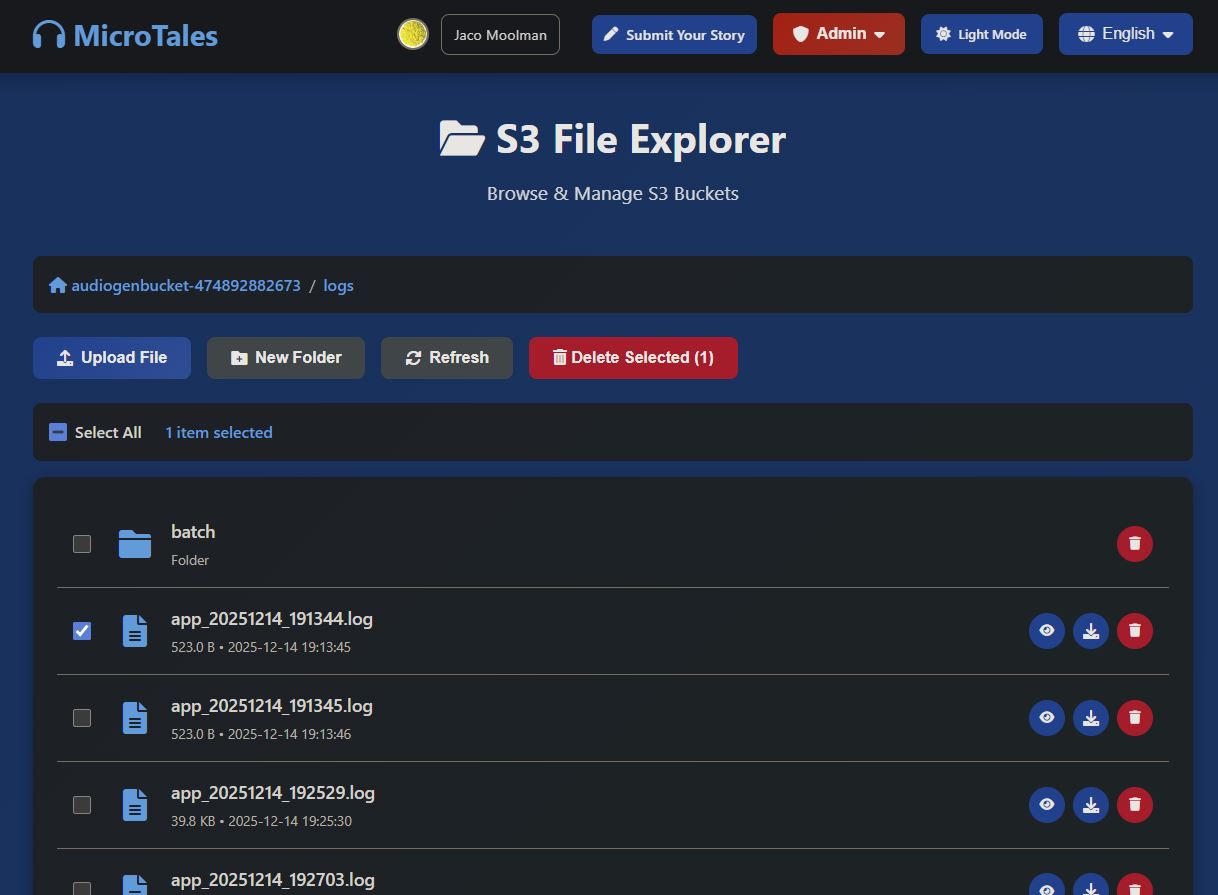
Since I had an s3 file viewer I might as well have a Dynamodb viewer. This would allow me to view all the tables and also edit individual entries without having to log into AWS s3. If I needed to update say a config somewhere I could quickly do it here.
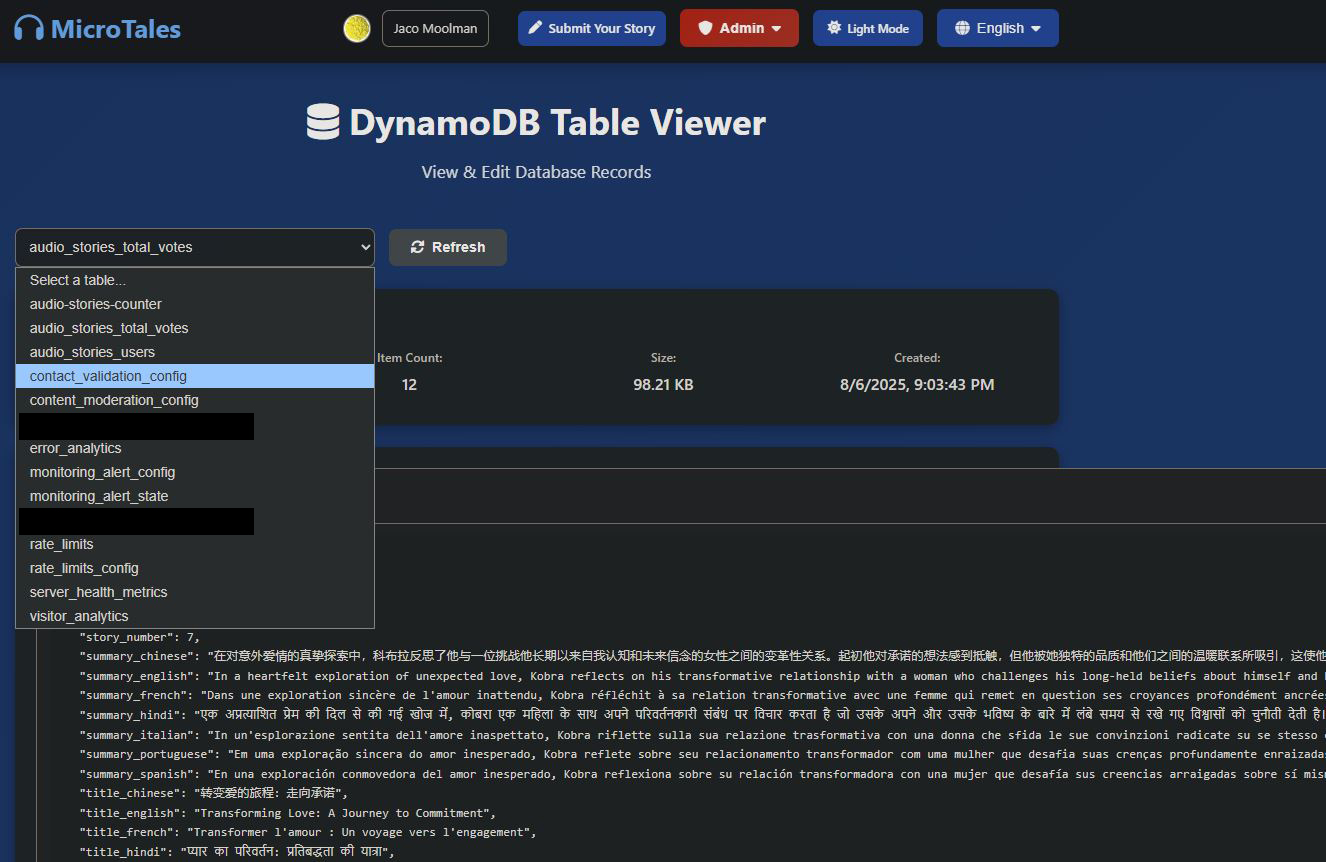
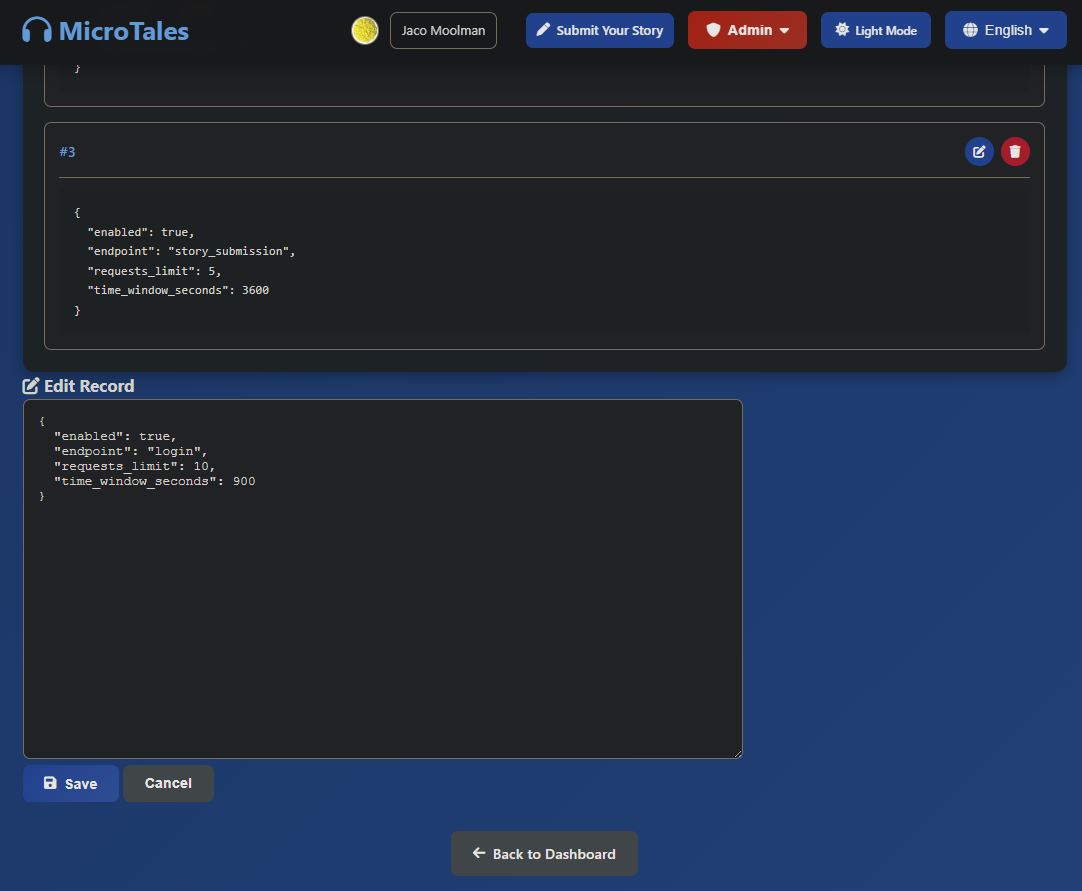
Now since I know you read this whole blog in details and not just scrolled down to the bottom here is the link to the application. Feel free to submit your own story to listen to it in multiple languages.
https://microtales.xyz/
Thank you and have a wonderful day!